

This analysis focuses on gold and silver within the Comex/CME futures exchange. See the article What is the Comex? for more detail. The charts and tables below specifically analyze the physical stock/inventory data at the Comex to show the physical movement of metal into and out of Comex vaults.
Registered = Warrant assigned and can be used for Comex delivery, Eligible = No warrant attached – owner has not made it available for delivery.
Current Trends
Both gold and silver have recently entered backwardation in the spot market. While the futures market is still in contango, the spot market has been steadily above the futures market. Usually, this is a brief occurrence that quickly reverses, but it has been ongoing for several weeks now. The charts below show the average monthly difference between futures and spot.
(Click on images to enlarge)
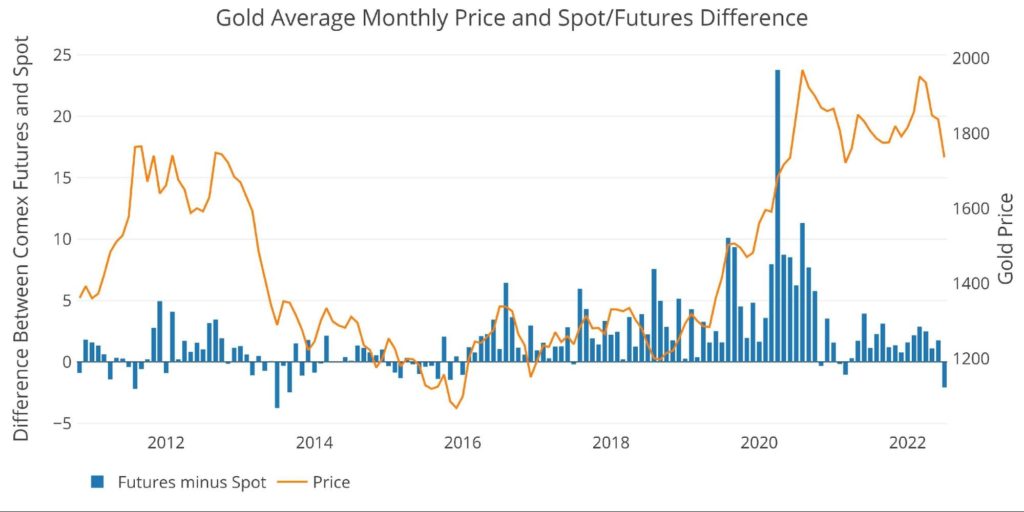
Figure: 1 Recent Monthly Stock Change
Gold is in the largest average backwardation since September 2013, for silver, it is July 2013. In the past, backwardation is usually caused by a large difference in price that quickly reverses. The big move pulls the average down. It’s rare to see prolonged periods like the one experienced this month. It’s also important to note that the chart above shows backwardation does not necessarily mean a price surge is coming. That being said, understanding the move can give clues to what’s going on under the surface.
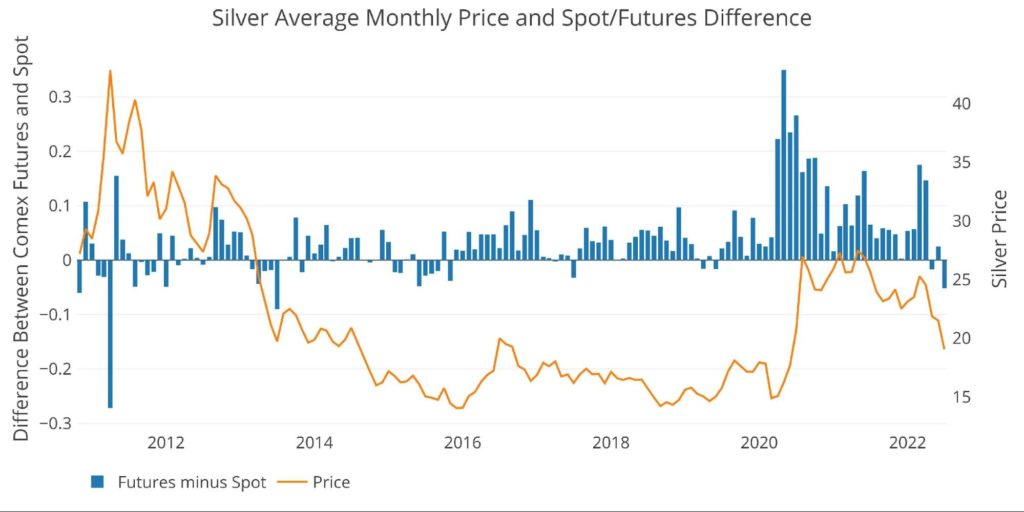
Figure: 2 Recent Monthly Stock Change
Backwardation is rare in precious metals because it’s an immediate arbitrage opportunity for traders. Anyone with physical metal can sell their metal at the spot price and then buy a futures contract at a cheaper price and hold it until delivery.
If spot gold is $1710 and August futures are $1705 then a trader can execute this trade for an immediate $5 an ounce profit (minus fees). It becomes even less likely for the curve to be in backwardation further out because the saved storage cost should cover most other fees.
Thus, a market in backwardation should see traders making their metal available for delivery and hedging their position by buying futures to bring the price back into contango. The Comex data shows the exact opposite is happening.
Gold
After restocking inventories for two months in March and April, Comex vaults have seen almost all of the inventory increase reversed since May. The reduction has been in both Registered and Eligible and is the largest reduction in metal since the Reddit silver squeeze last year. Why is metal leaving the vault when there is an easily profitable trade if investors delay delivery?
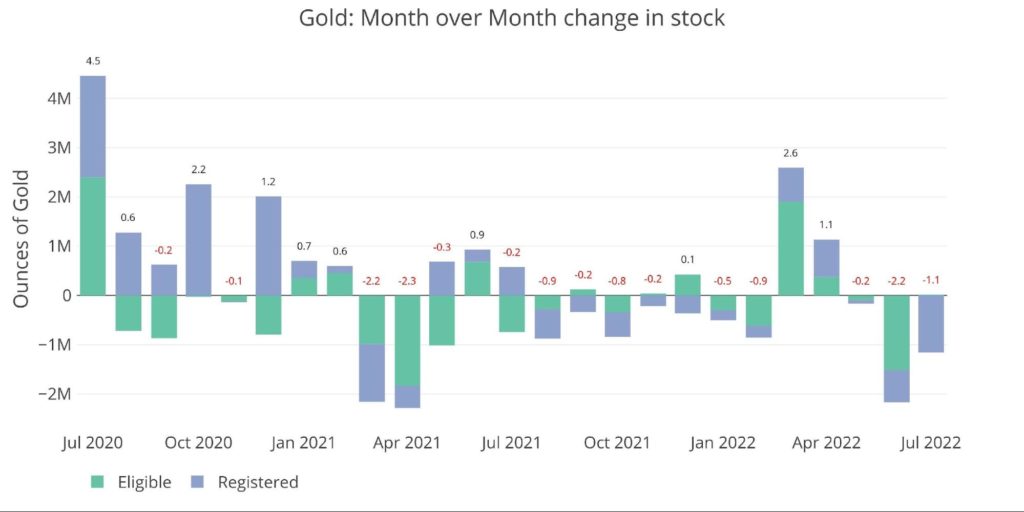
Figure: 3 Recent Monthly Stock Change
As shown below, this has been a very consistent removal of metal from the vault. Registered has seen no additions in the last 30 days and Eligible has seen additions that have only come from Registered rather than new metal. This is metal that is no longer available for delivery. Backwardation started at the beginning of July, and removal from Registered has accelerated since this time.
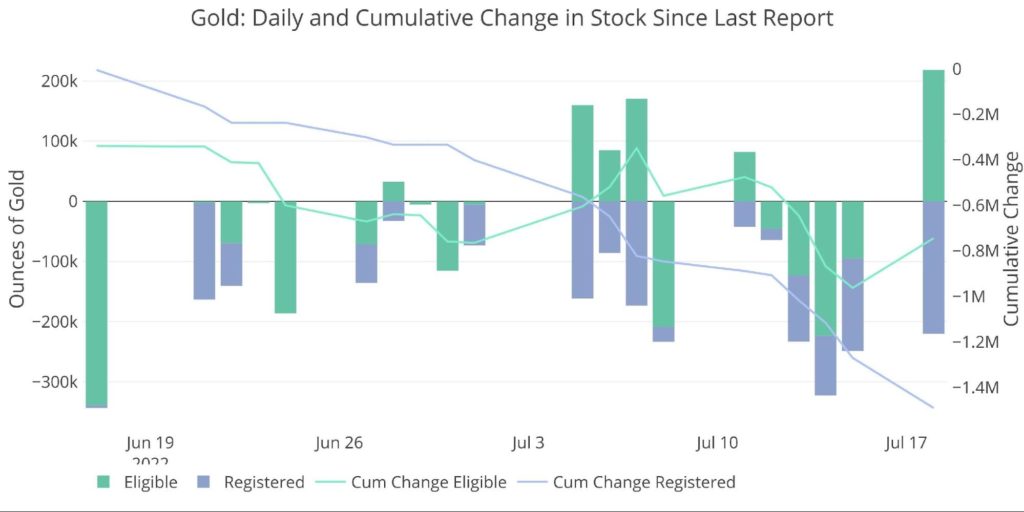
Figure: 4 Recent Monthly Stock Change
Silver
The action in silver is a bit more nuanced and potentially more significant. Although the chart below shows that metal has been added to the vault on a net basis, Registered has seen a significant decline. This decline has been over four straight months and seven of the last eight.
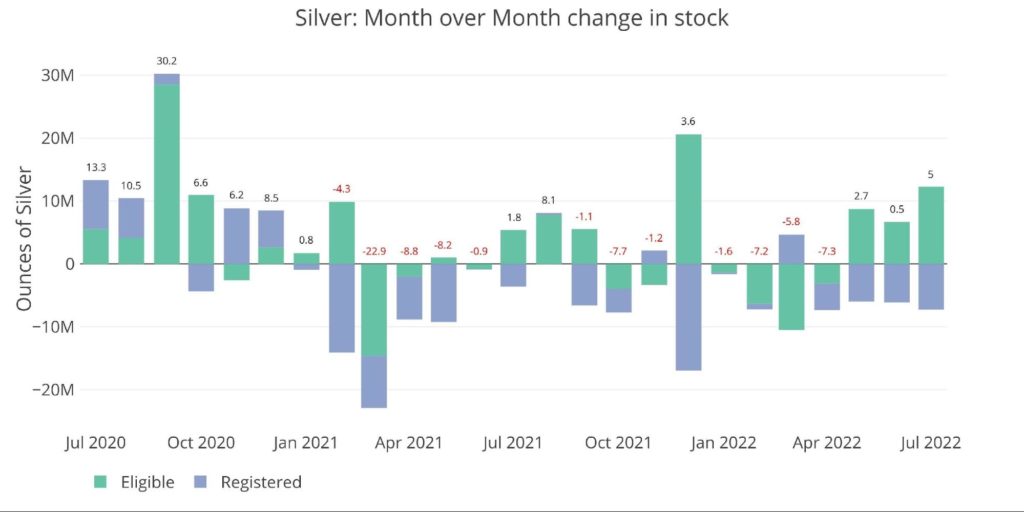
Figure: 5 Recent Monthly Stock Change
The chart below shows the consistent reduction in silver Registered, with nearly 5.4m ounces moving from Registered to Eligible on July 12th. This represents holders removing their metal from available delivery supply.
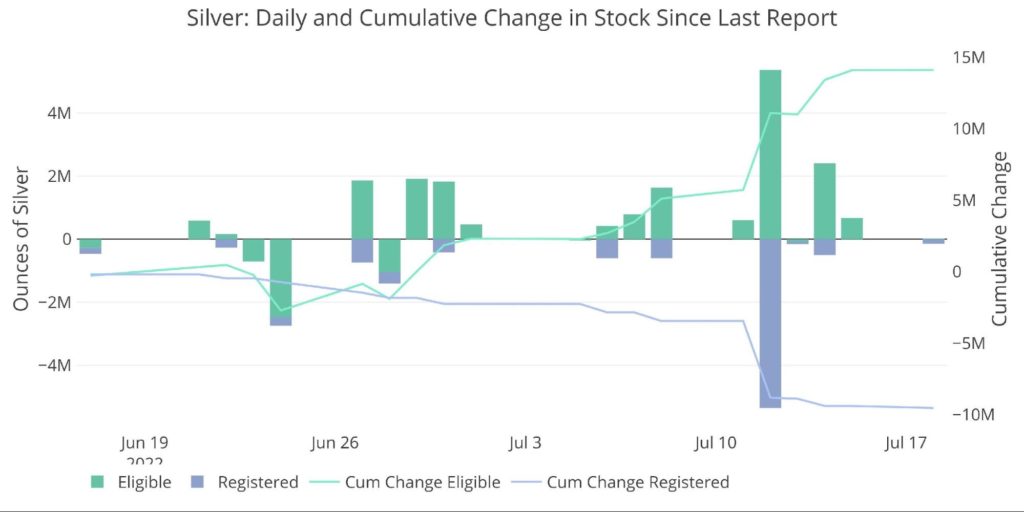
Figure: 6 Recent Monthly Stock Change
In 2013 when both metals were in backwardation, gold saw Registered inventories stay flat and silver saw steady increases. In 2015, the opposite occurred, and Registered inventories were being depleted. It should be noted that this marked a bottom in both metals.
The table below summarizes the movement activity over several time periods to better demonstrate the magnitude of the current move.
Gold
-
- Over the last month, gold has seen Registered fall by 7.5% or 1.5M ounces
-
- Combined with the outflow in Eligible, total inventories dropped 6.1%, or 2.2M ounces
- Much of this occurred in the last week showing an acceleration
-
- Inventory is down over the past year by 9%
- Eligible is down 6.3% and Eligible down by 11%
- Over the last month, gold has seen Registered fall by 7.5% or 1.5M ounces
Silver
-
- Silver Registered is down by 13.3% over the last month alone, this is on the heels of an 11.7% decline last month
-
- Registered silver is down an incredible 44% in the last year and 56% over three years
- This is metal that holders no longer want available for delivery
-
- Eligible is positive over the last month (5.3%), which prompted total silver inventories to increase by 1.4% or 4.5M ounces
- Silver Registered is down by 13.3% over the last month alone, this is on the heels of an 11.7% decline last month
Even though silver is flowing into Comex vaults, it’s not being made available for delivery. Again, this is very counterintuitive when the market has entered such consistent backwardation.
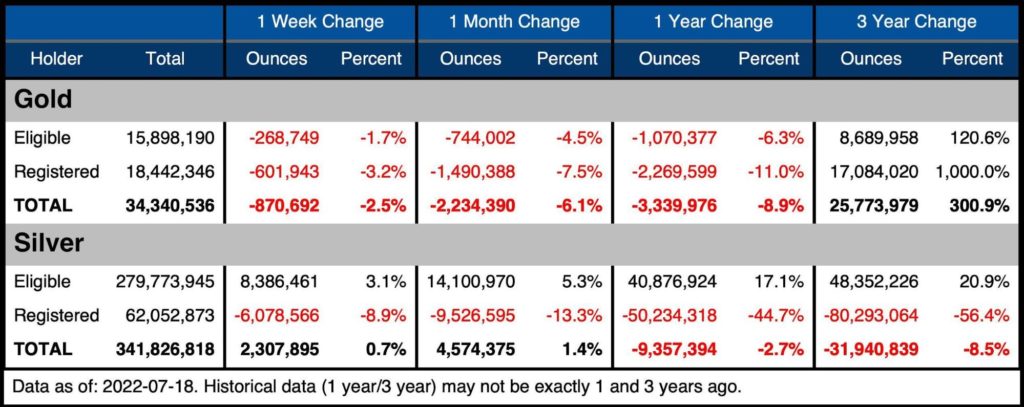
Figure: 7 Stock Change Summary
The next table shows the activity by bank/Holder. It details the numbers above to see the movement specific to vaults.
Gold
-
- Every vault saw outflows over the last week and month
- Loomis and Malca both experienced reductions greater than 20%!
-
- For Malca, the majority occurred in the last week
-
- JP Morgan had more than 770K ounces depart, half of which occurred in the last week
Silver
-
- Silver MoM was mixed with 3 vaults adding and 5 vaults seeing outflows
- On a net basis, the move was much smaller than some of the shuffling between vaults
- Within the vaults the moves were far more pronounced
-
- Brinks lost 12.5% or 5.5M ounces
- Loomis and Manfra both saw outflows greater than 1M ounces
- JP and CNT were the big adders with a combined 13.2M ounces
-
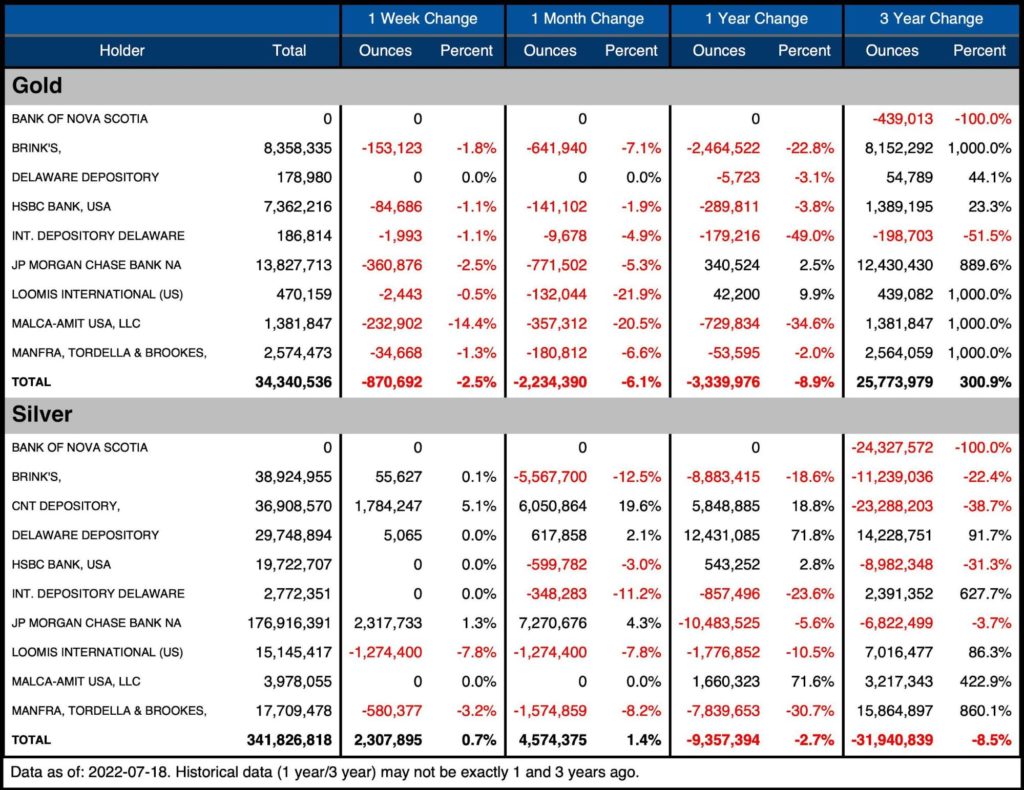
Figure: 8 Stock Change Detail
Pledged gold (a subset of Registered), has set a new record at 2.44M ounces. Although Pledged is considered a subset of Registered, it cannot be made available for delivery without the Pledge being removed. Pledged represents gold that has been pledged as collateral. Removing Pledged from Registered in the table above would shrink the total Registered by 12%.
Pledged has increased quickly and dramatically since it bottomed in April. It has been mostly flat since the market entered backwardation.
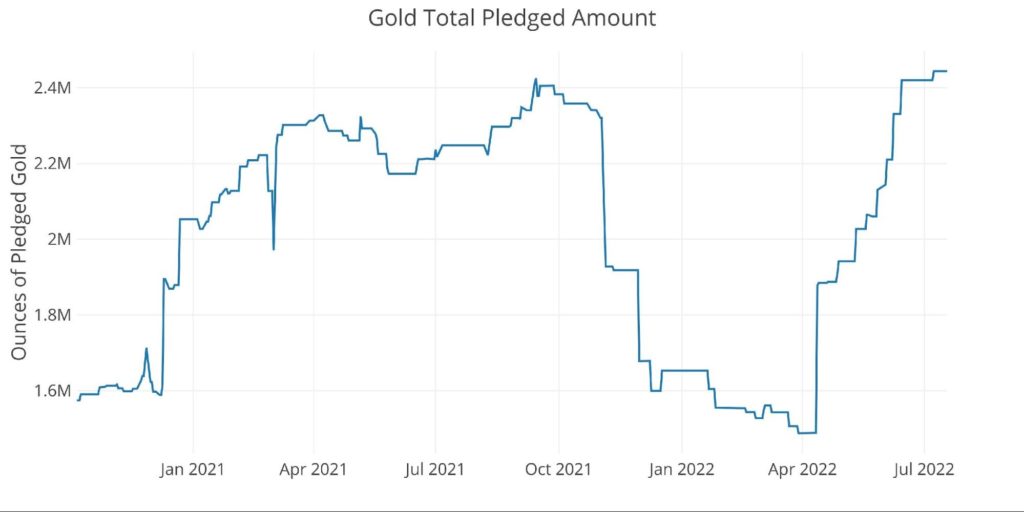
Figure: 9 Gold Pledged Holdings
Historical Perspective
Zooming out and looking at the inventory for gold and silver since 2014 shows the impact that Covid had on the Comex vaults. Gold had almost nothing in the Registered category before JP Morgan and Brinks added their London inventory with nearly 20M ounces.
Since the restocking, there has been a slow pull of metal out of the vault. The effort to restock again in March is shown on the far right. This move has been completely undone by the metal flooding out of the vault since May.
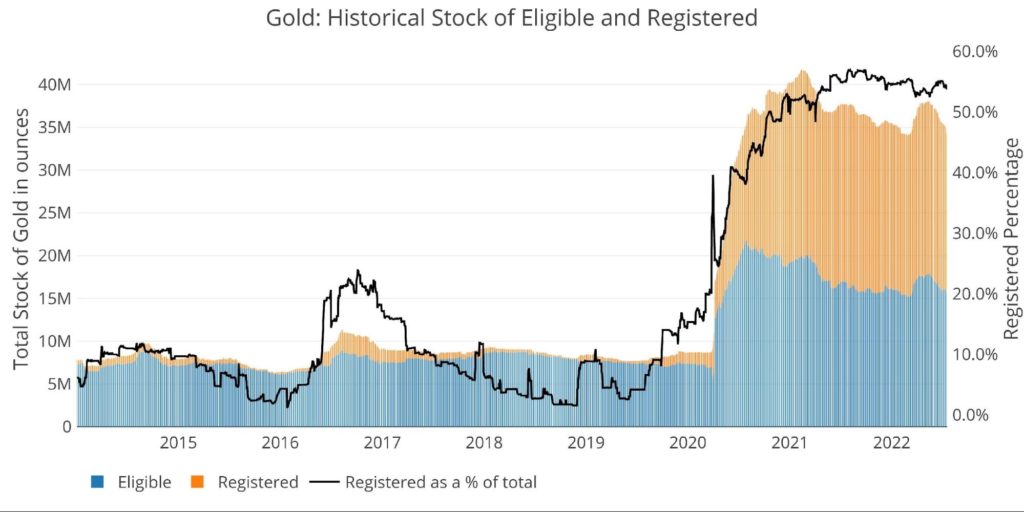
Figure: 10 Historical Eligible and Registered
Silver has seen a massive move down in Registered as a % of the total. After a recent spike in March up to 27.2%, it has since fallen to 18.2%. This is the lowest ratio since February of 2018 and shows the strain that has been put on the Registered market. Although the vaults have not been cleaned out, much less silver is available for delivery.
The sharp decline in Registered % is very similar to what happened in 2015. This is when the market was last in backwardation and also when the price found a bottom.
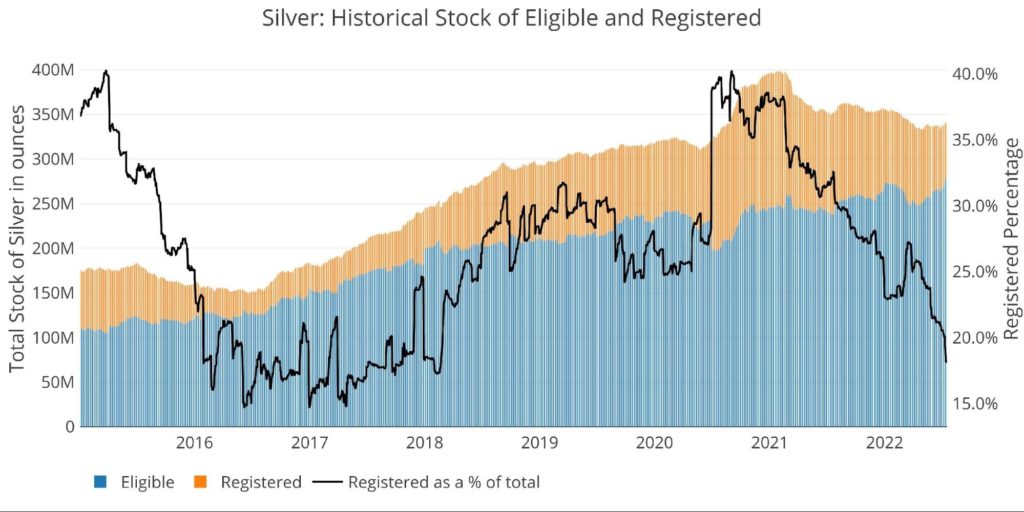
Figure: 11 Historical Eligible and Registered
Available supply for potential demand
As can be seen in the chart below, the ratio of open interest to total stock has fallen from over 8 to 1.6. In terms of Registered (available for delivery against open interest), the ratio collapsed from nose bleed levels (think Nov 2019 where 100% stood for delivery) down to 2.93 in the latest month. The move down has been driven by a drop in inventories with a spike up in open interest.
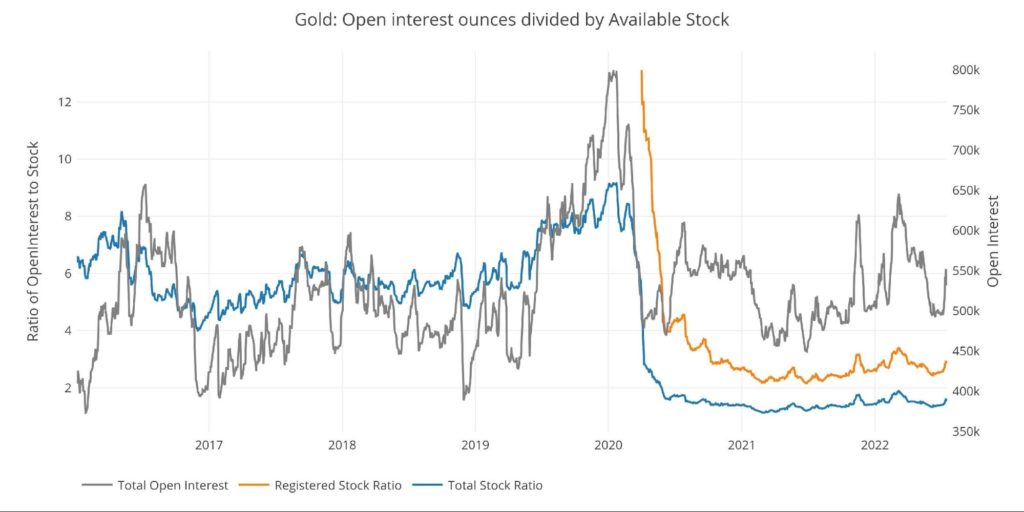
Figure: 12 Open Interest/Stock Ratio
Coverage in silver is weaker than in gold with 11.98 open interest contracts to each available physical supply of Registered (up from 8.2 at the end of April). The ratio has been driven up by a recent increase in open interest, along with the continued movement out of Registered.
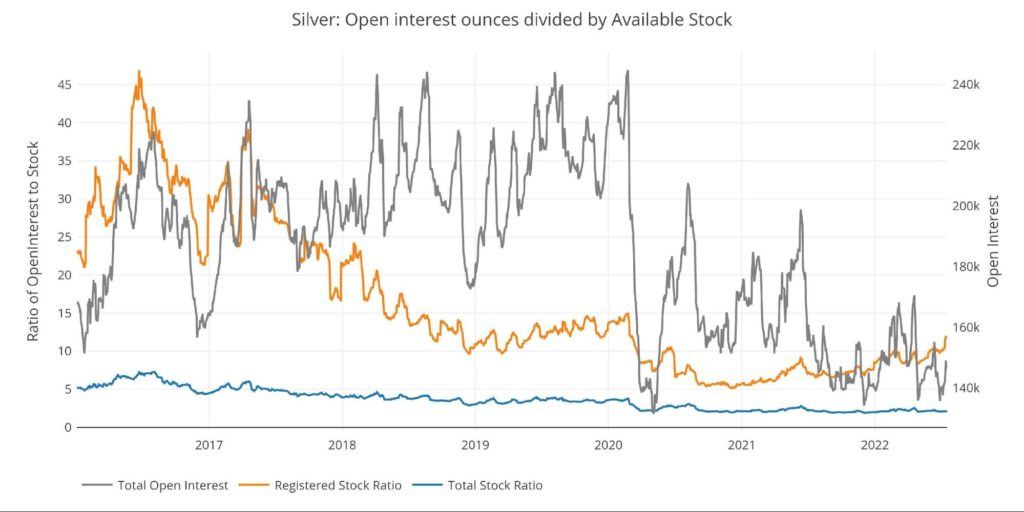
Figure: 13 Open Interest/Stock Ratio
Wrapping Up
As mentioned, backwardation does not necessarily mean a price surge is coming. That being said, it’s clear the market is under stress. Prices are way down, but that is not the whole story. Physical metal is leaving the vault despite a profitable trade to be had.
Later this week, the Comex Countdown will be published. The Comex Results showed a very weak market. Things have changed quite dramatically in gold, with near record net new contract deliveries. Check out that report on Friday!
Another major data point to watch is the short position of speculators. The Commitment of Traders report shows that Managed Money has gone short in silver. In the latest week, gold has also gone long to short. What’s interesting is that this coincided with a drop in margin rates and an increase in open interest. This means that the increased open interest was driven by short traders, not long traders. These short traders are taking advantage of lower margin rates to increase their leverage on the short side. This sets up very well for a potential short squeeze if the market starts to rebound.
Bottom line, prices are down. However, there is clearly more to the story. Short speculators have driven the paper market lower, but the physical market is starting to diverge. Backwardation exists because traders are holding onto their physical metal rather than making it available for delivery.
Furthermore, the traders who are taking advantage of the arbitrage will want their physical back when the contracts expire in the months ahead. The spec shorts could be forced to deliver physical and find it hard to come by at current prices. This could cause a spectacular rebound in prices.
Data Source: https://www.cmegroup.com/
Data Updated: Daily around 3 PM Eastern
Last Updated: Jul 18, 2022
Gold and Silver interactive charts and graphs can always be found on the Exploring Finance dashboard: https://exploringfinance.shinyapps.io/goldsilver/
More By This Author:
Ukraine Sells Billions In Gold To Raise Cash To Buy Goods
Does The Jump In Retail Sales Mean The Economy Is OK?
Producer Prices Close To Record Levels In June


Comments
Log in or sign up to join the conversation.