
The Comex report for last month correctly identified a potential big move in silver while the same report two months ago preceded a massive up move for the price of gold. The data this month is not as obvious or compelling, but it is clear the stress on the Comex continues to build.
The CME Comex is the Exchange where futures are traded for gold, silver, and other commodities. The CME also allows futures buyers to turn their contracts into physical metal through delivery. You can find more details on the CME here (e.g., vault types, major/minor months, delivery explanation, historical data, etc.).
The data below looks at contract delivery where the ownership of physical metal changes hands within CME vaults. It also shows data that details the movement of metal in and out of CME vaults. It is very possible that if there is a run on the dollar and a flight into gold, this is the data that will show early warning signs.
Gold
The analysis last month showed open interest in gold at well above trend. That trend held into the delivery period. June is a major delivery month in gold and saw more than 30k contracts stand for delivery. This was the largest delivery volume since August 2022 by a wide margin.
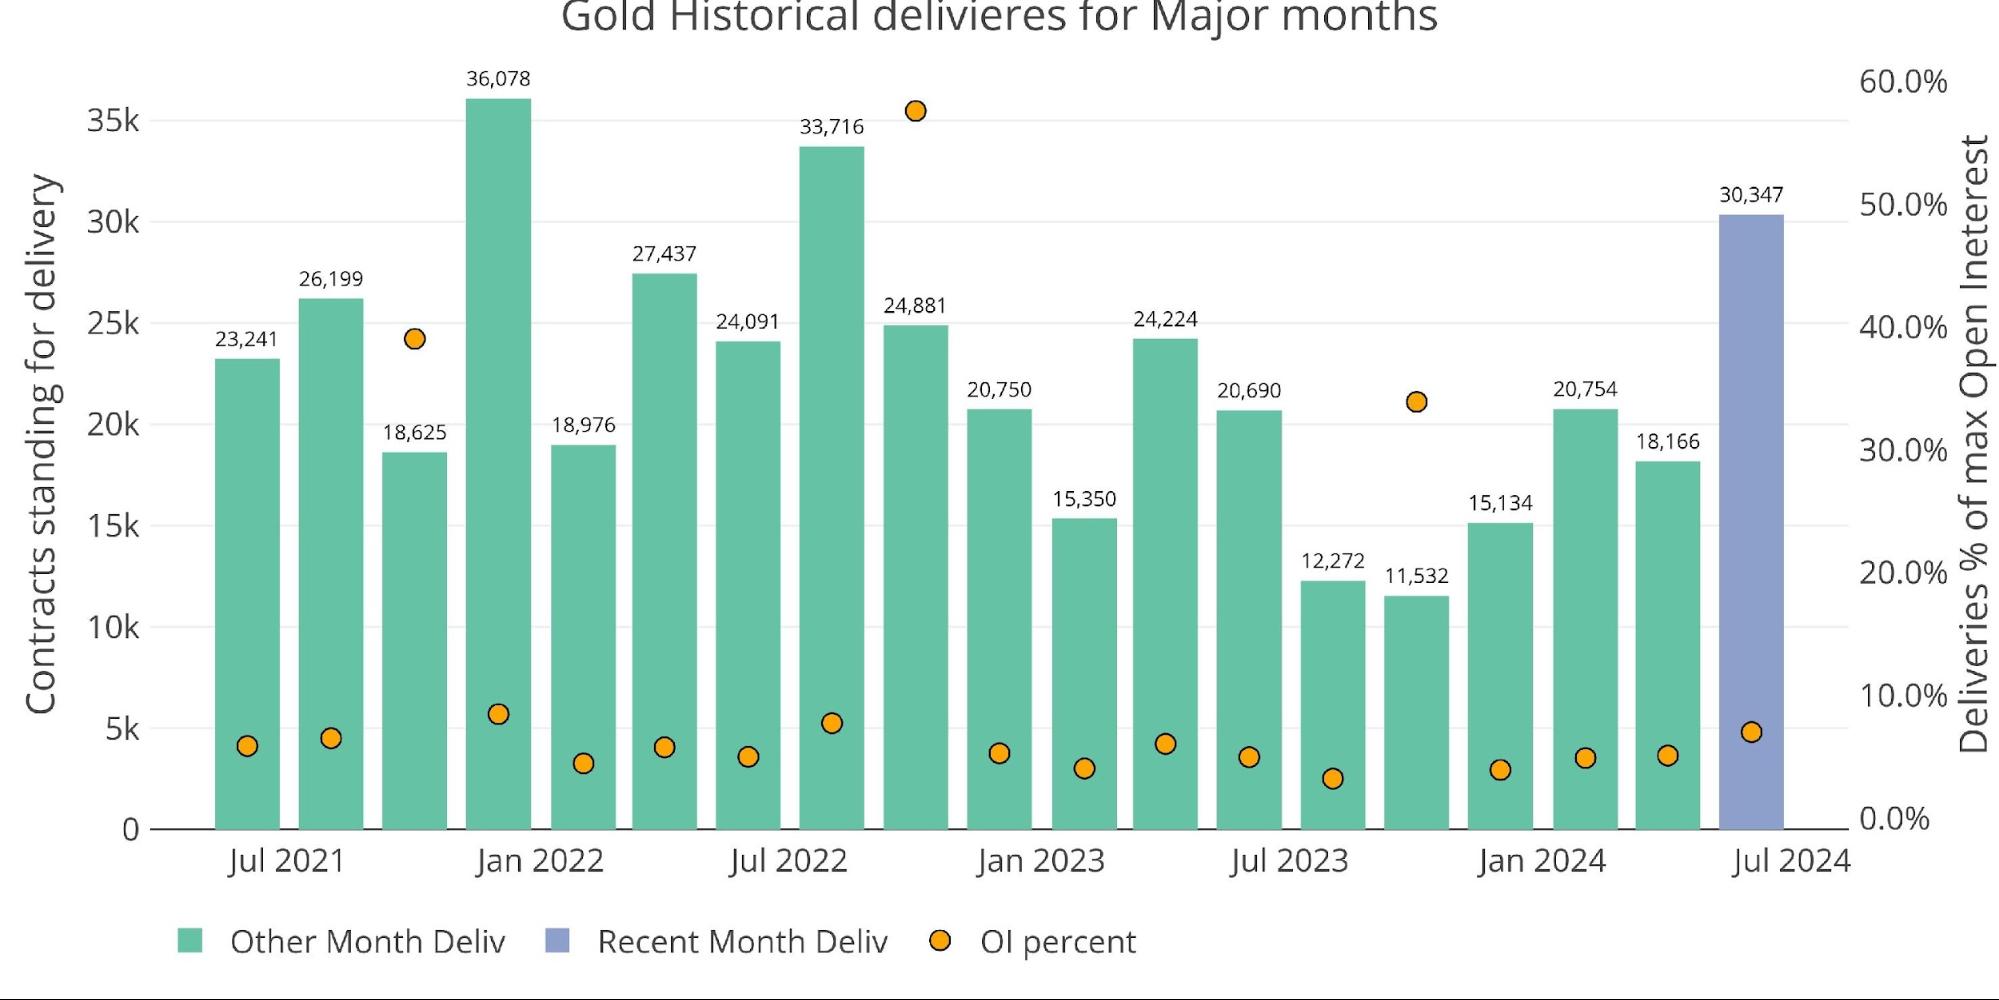
Figure: 1 Recent like-month delivery volume
Unlike most months, the massive delivery volume was NOT driven by net new contracts. June started out the gate with massive volume and was only somewhat supplemented by about 1500 net new contracts.
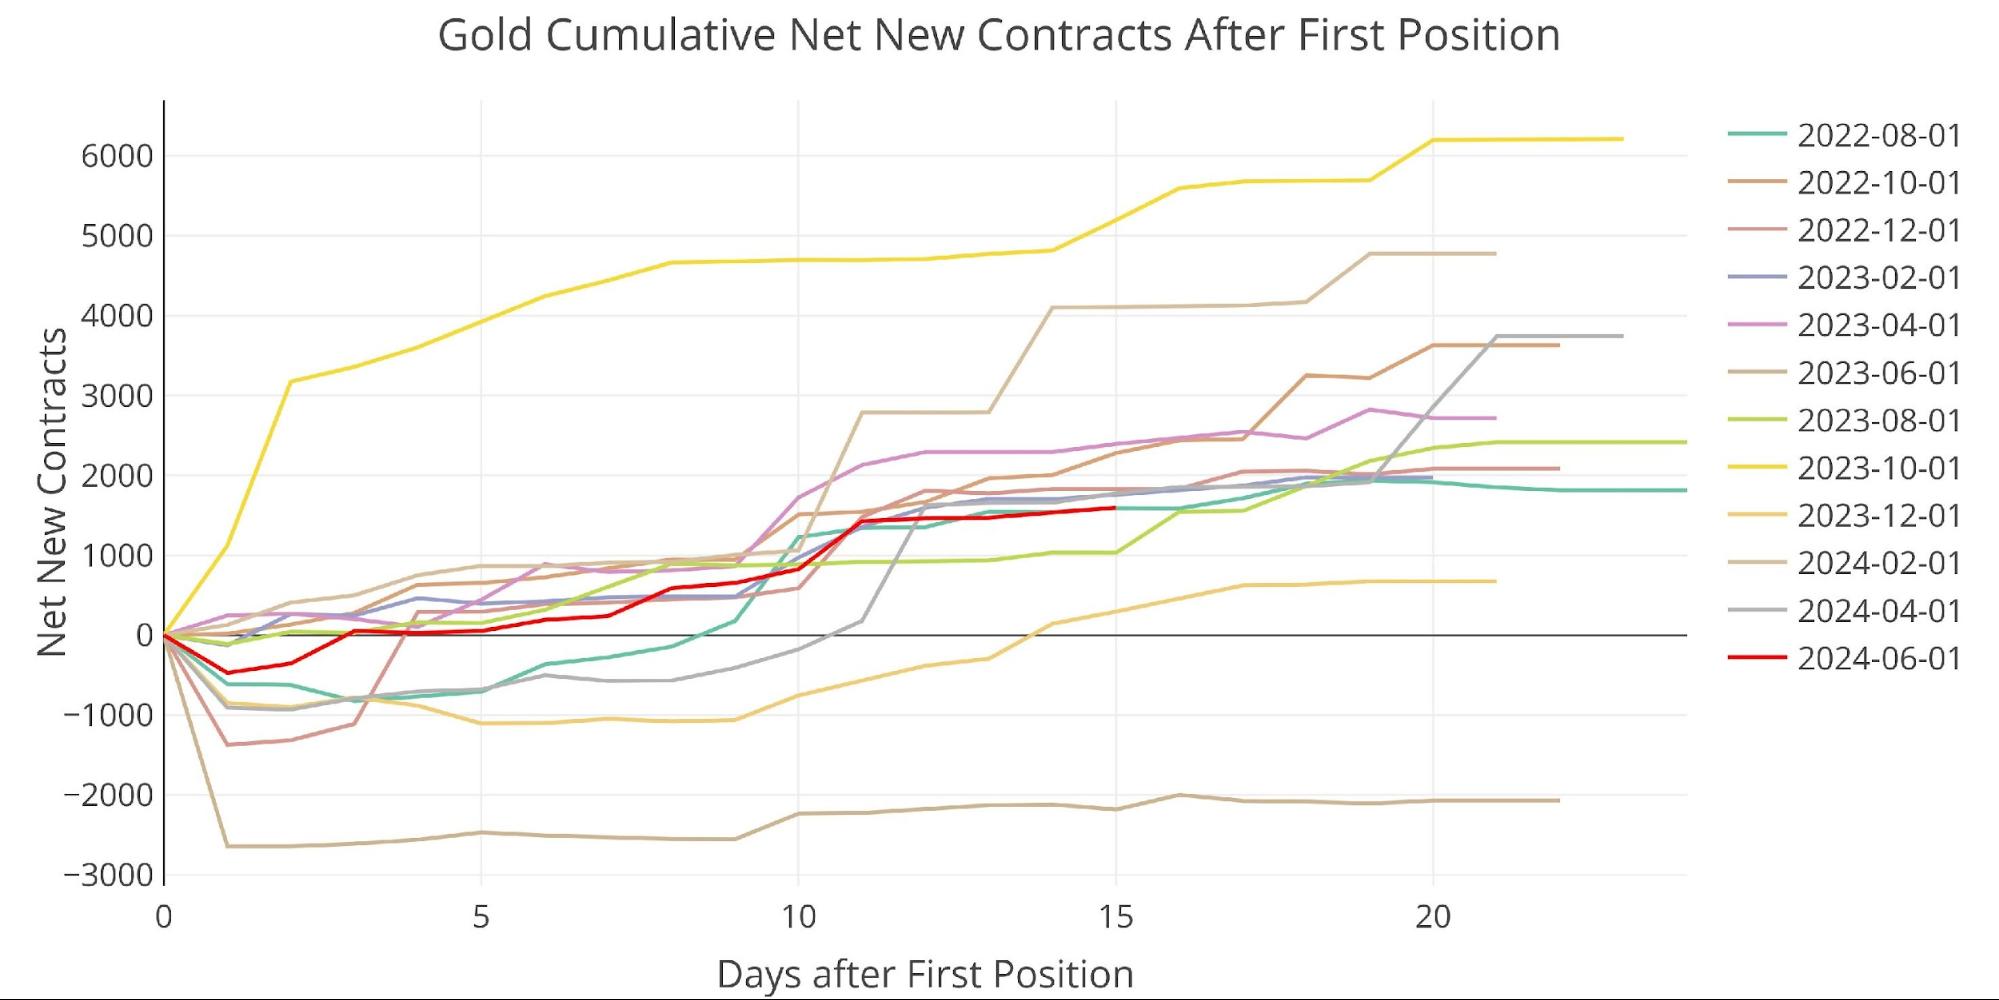
Figure: 2 Cumulative Net New Contracts
Yesterday also saw a major move from Registered back to Eligible. This moves the metal out of the pool available for delivery.
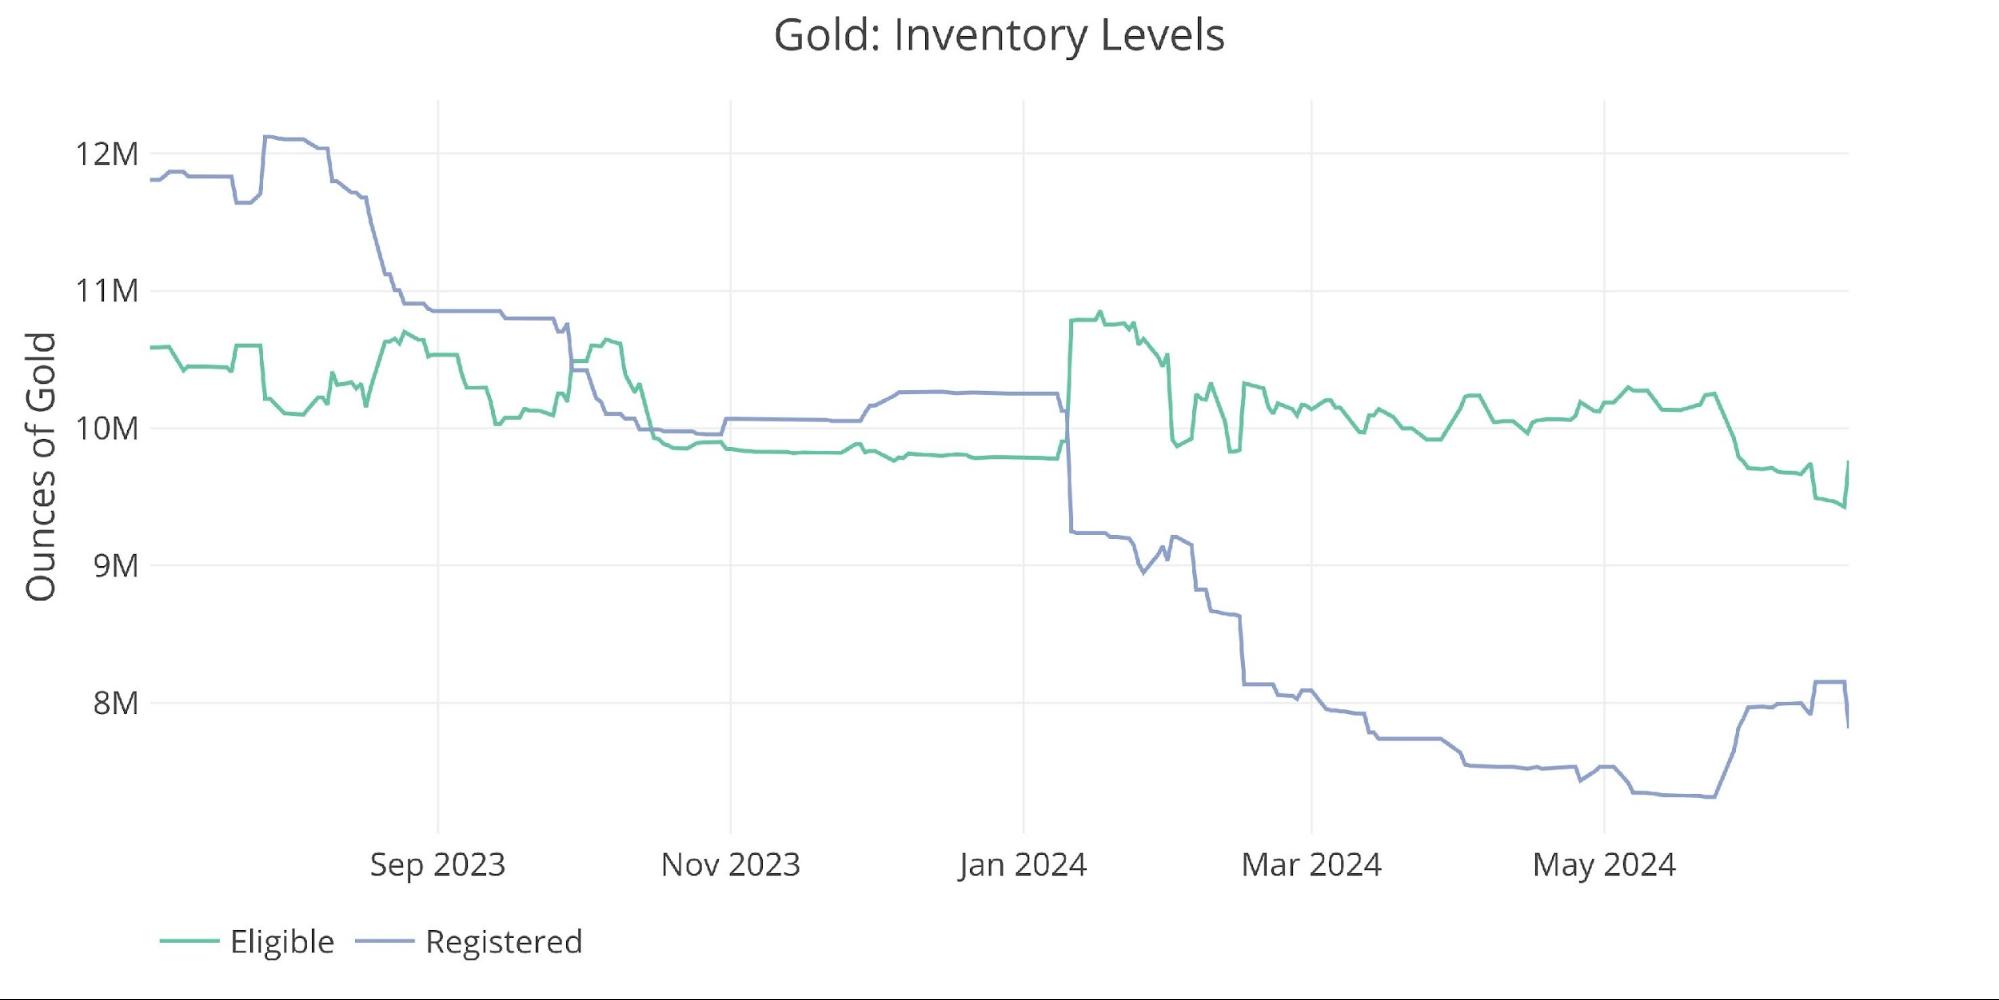
Figure: 3 Inventory Data
Heading into the minor delivery month of July shows Open Interest is trending upwards into the close.
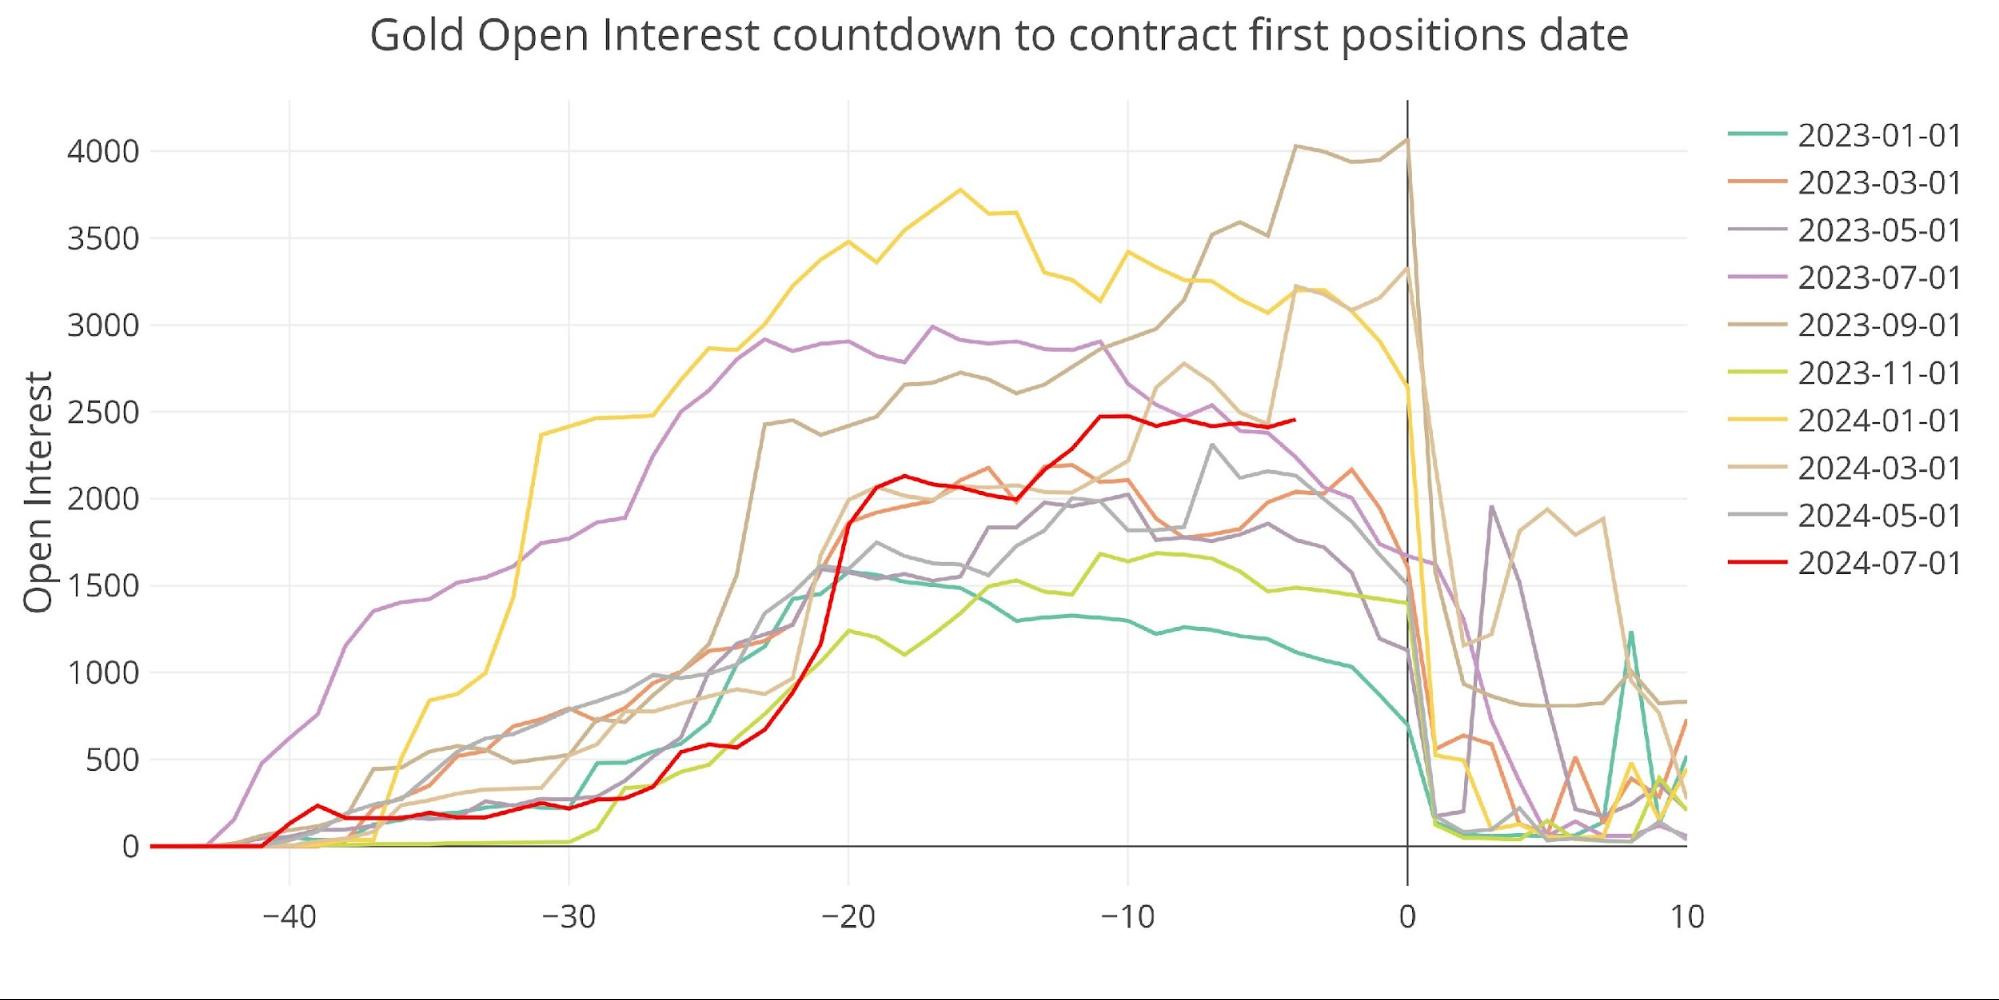
Figure: 4 Open Interest Countdown
On a relative basis, the open interest still remains elevated compared to recent history.
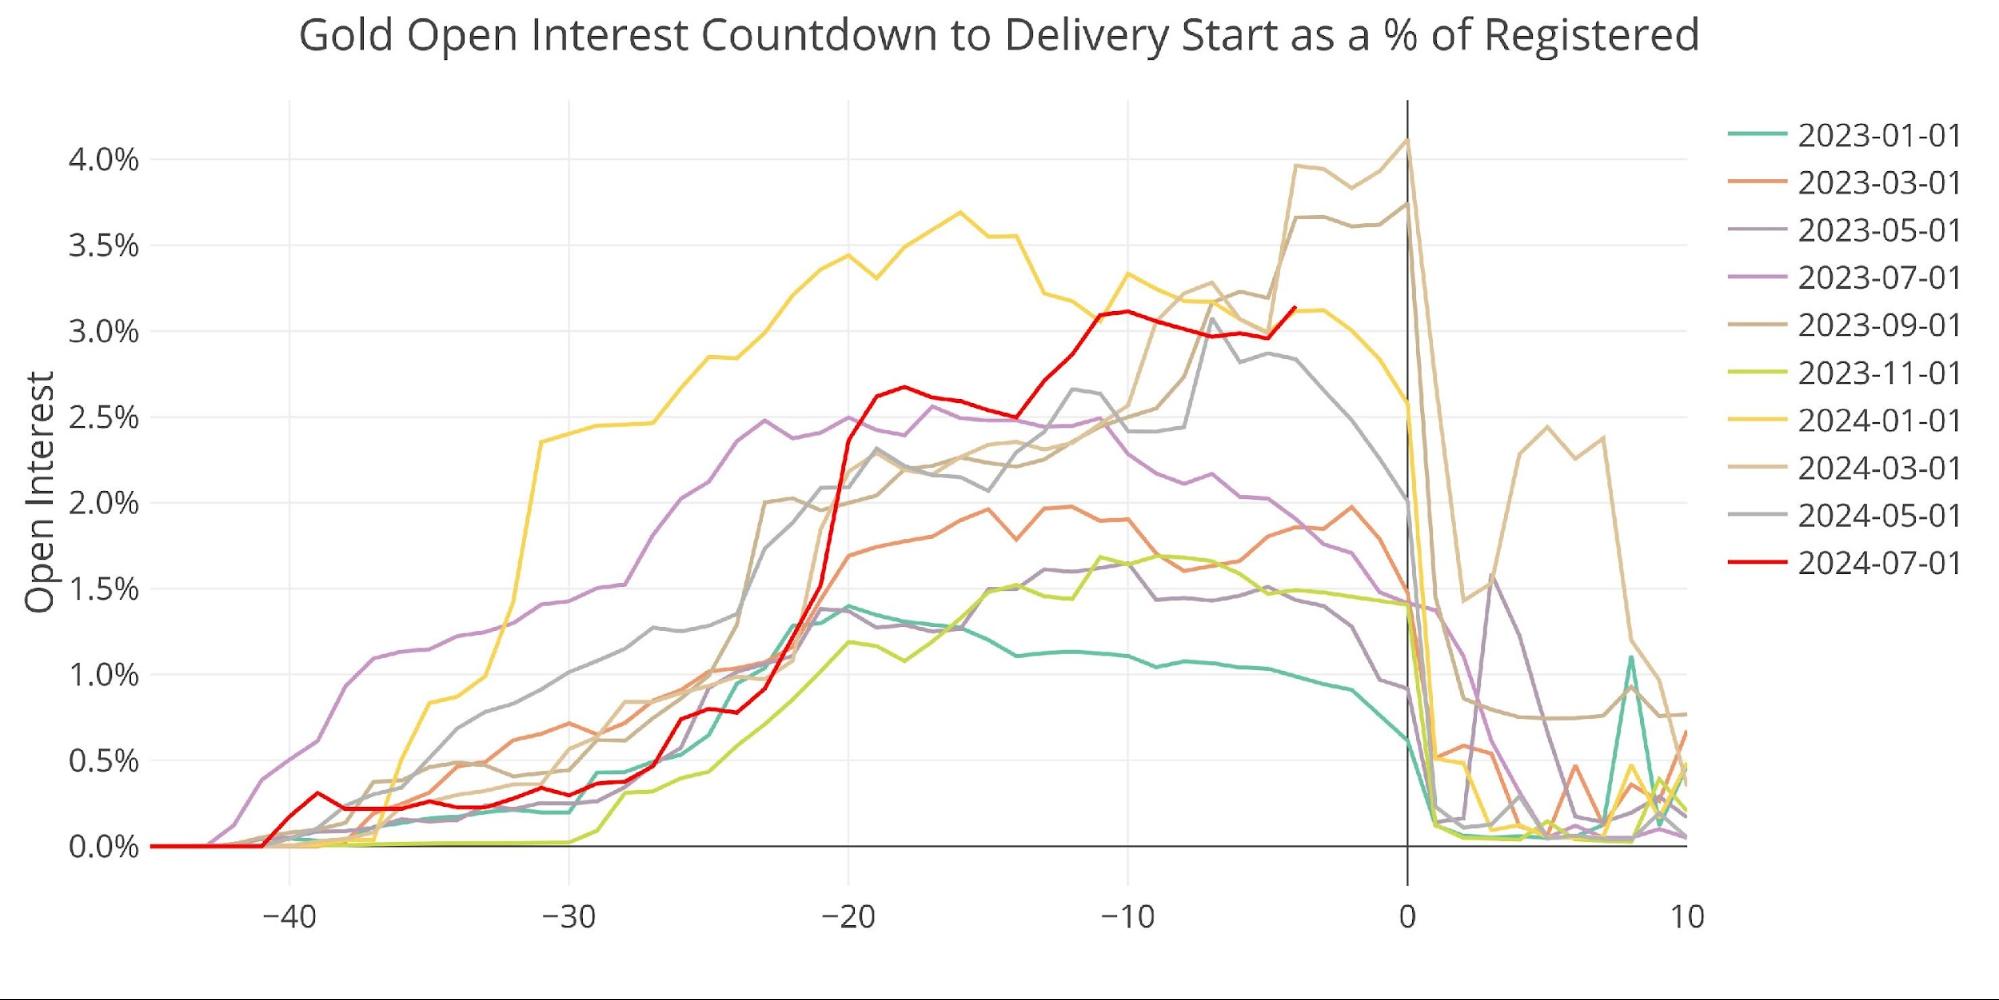
Figure: 5 Open Interest Countdown Percent
Silver
June silver saw a modest 1,331 contracts stand for delivery. June is a minor month in silver, but the chart below shows how activity in silver has definitely picked up after a pretty quiet 2023.
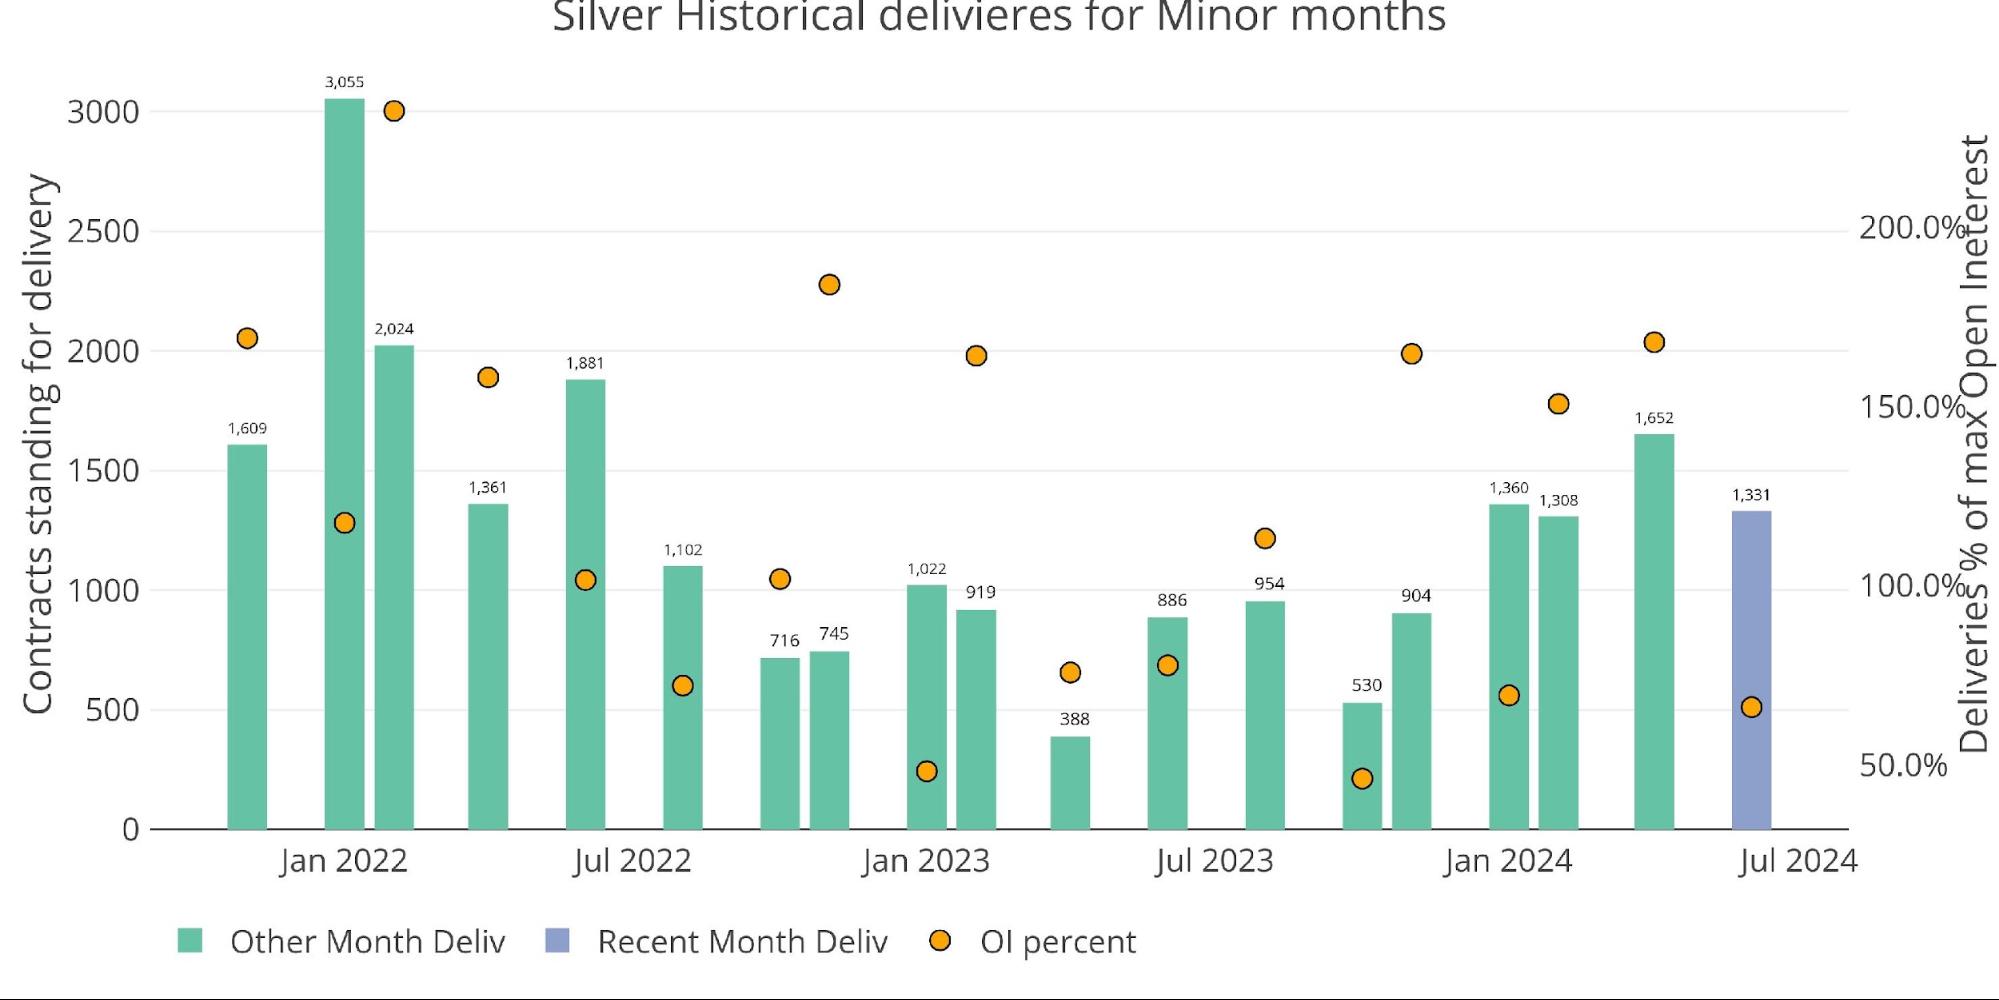
Figure: 6 Recent like-month delivery volume
The delivery volume was partially driven by net new contracts which represented about 572 of the total contracts delivered.
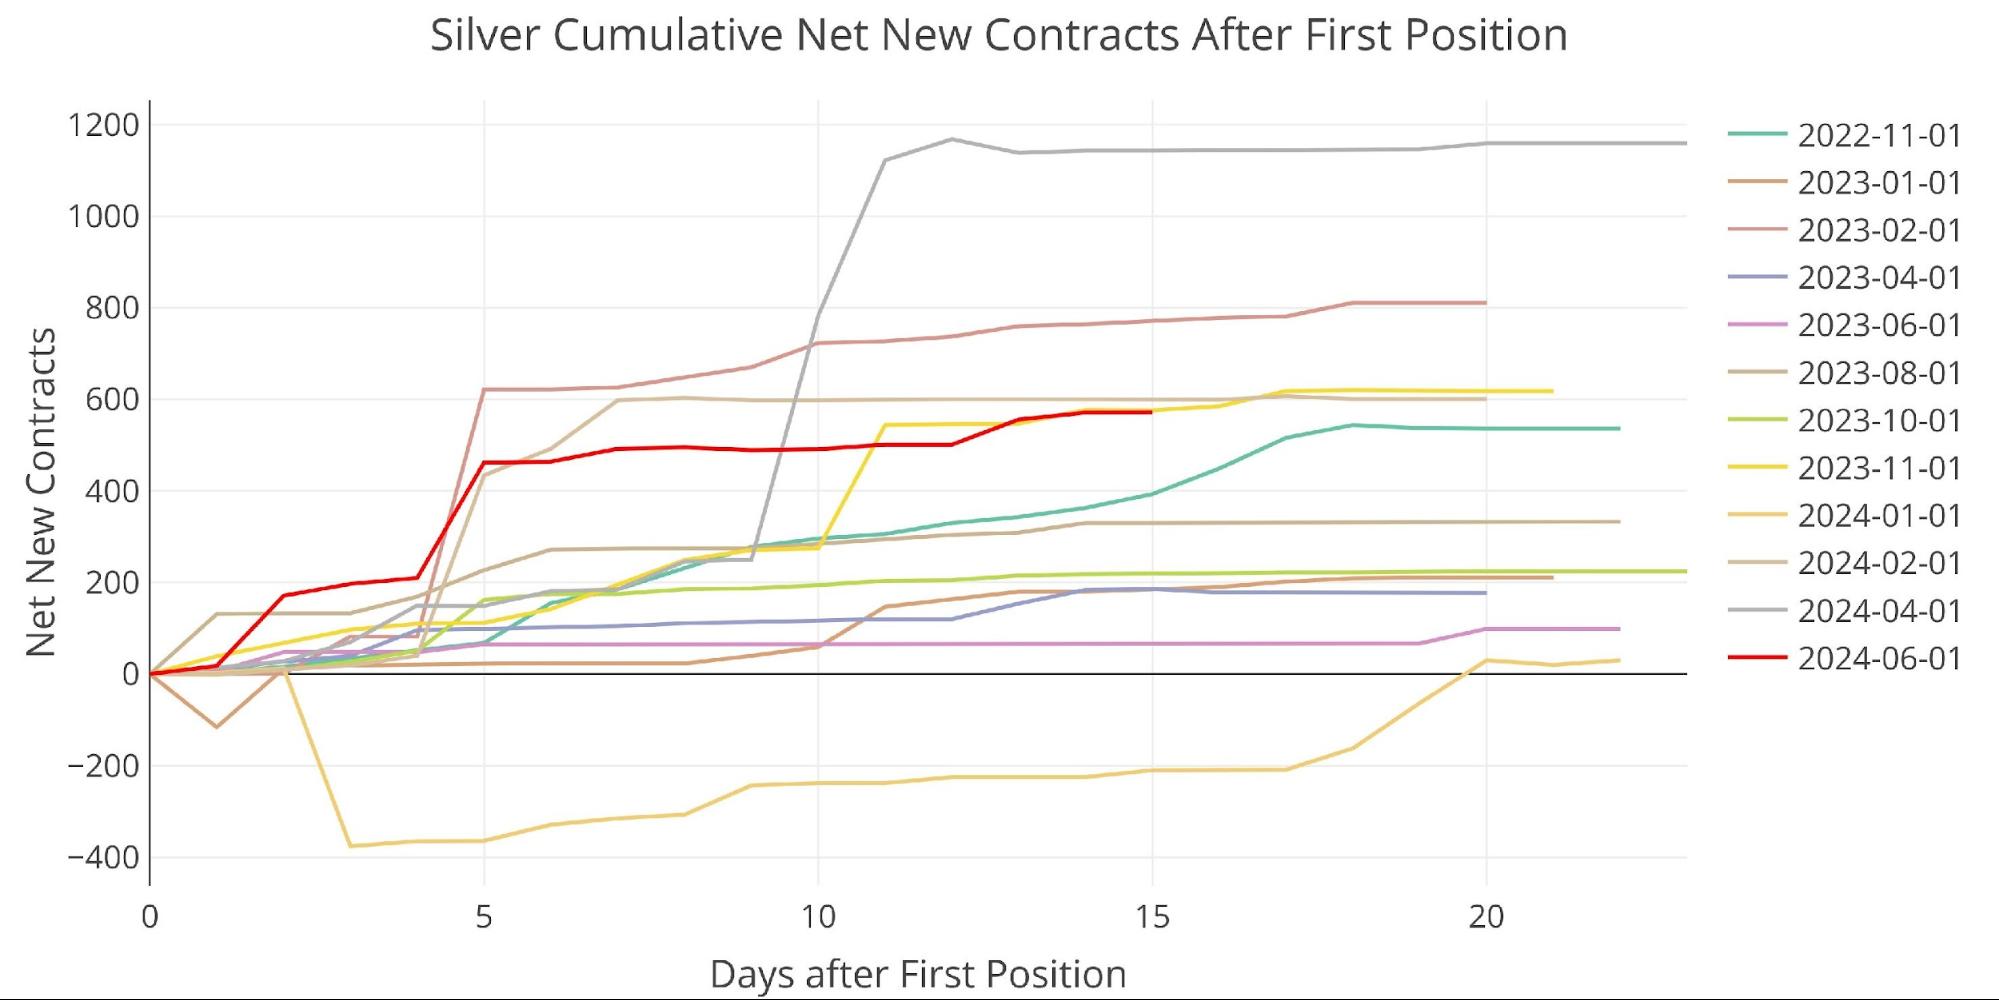
Figure: 7 Cumulative Net New Contracts
Registered and Eligible have been plotted separately to make the charts more readable. Eligible was fairly flat in June.
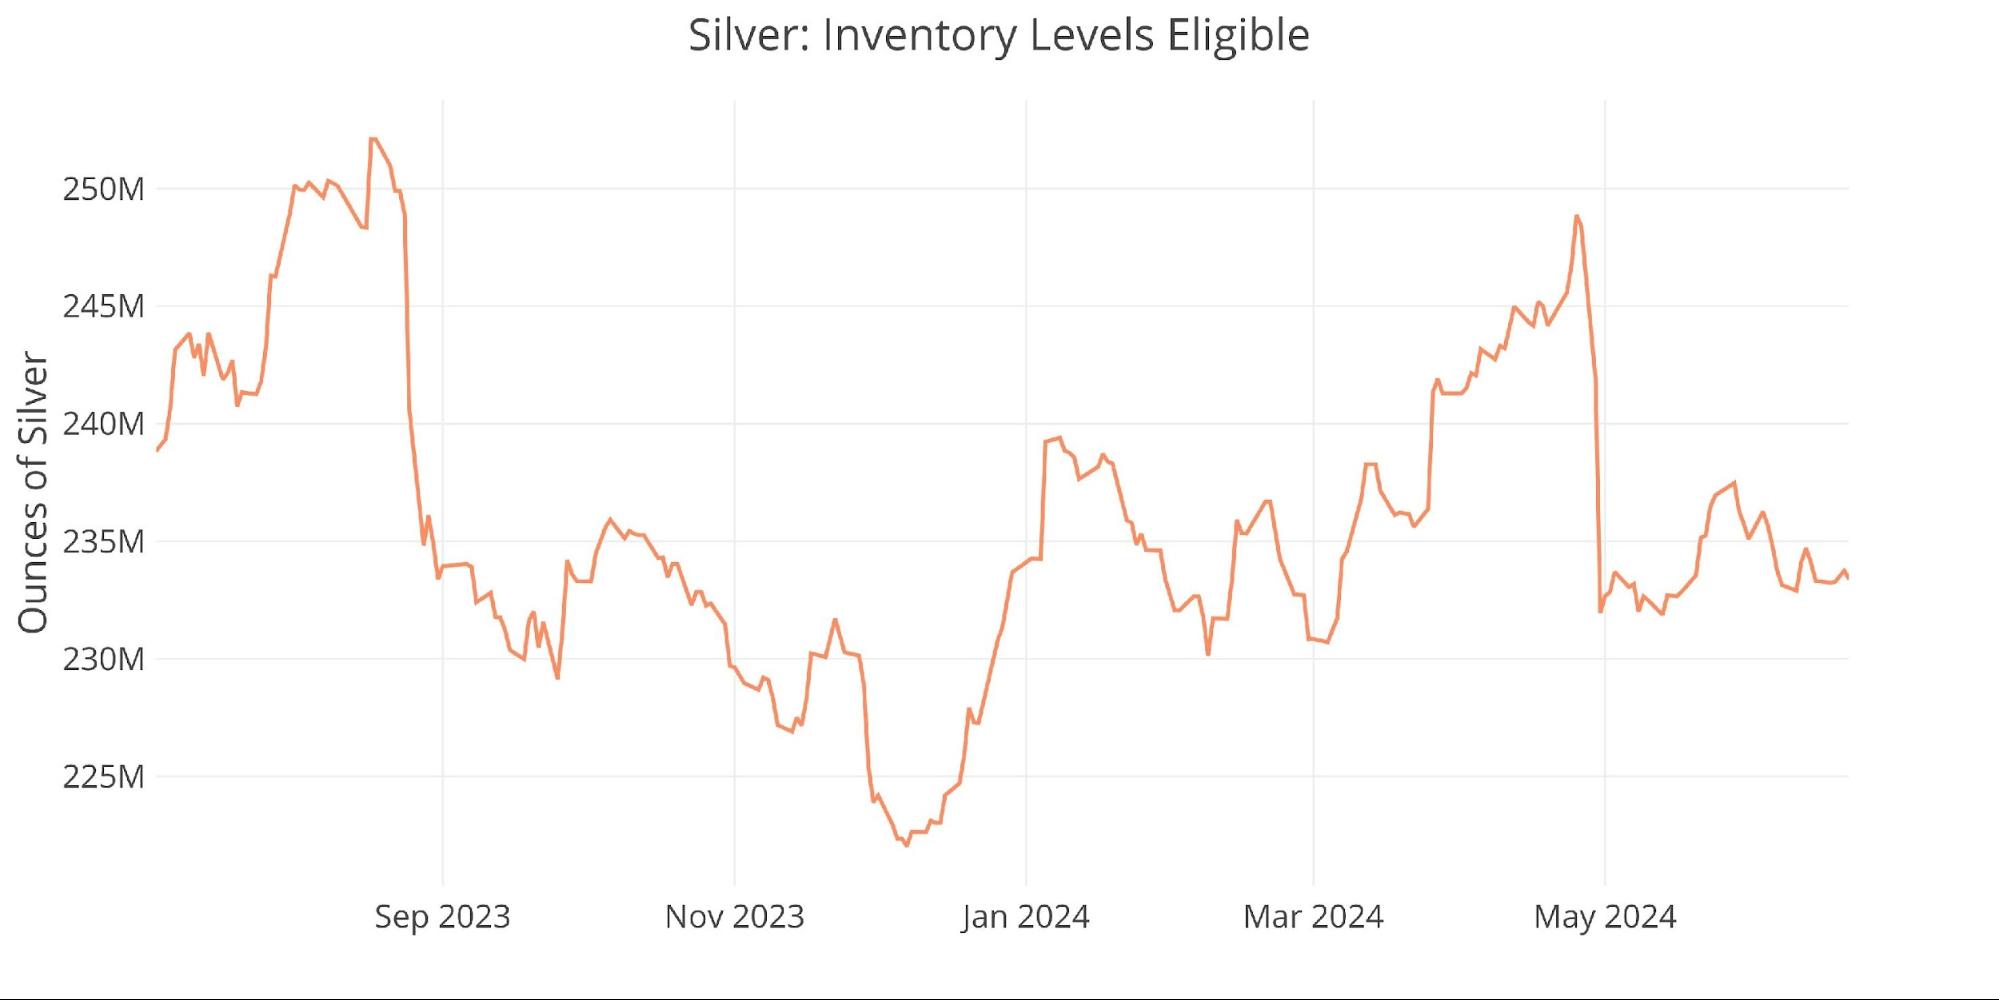
Figure: 8 Inventory Data
Registered also remained fairly flat after the big increase in May. This is the highest level of Registered in several years (metal available for delivery).
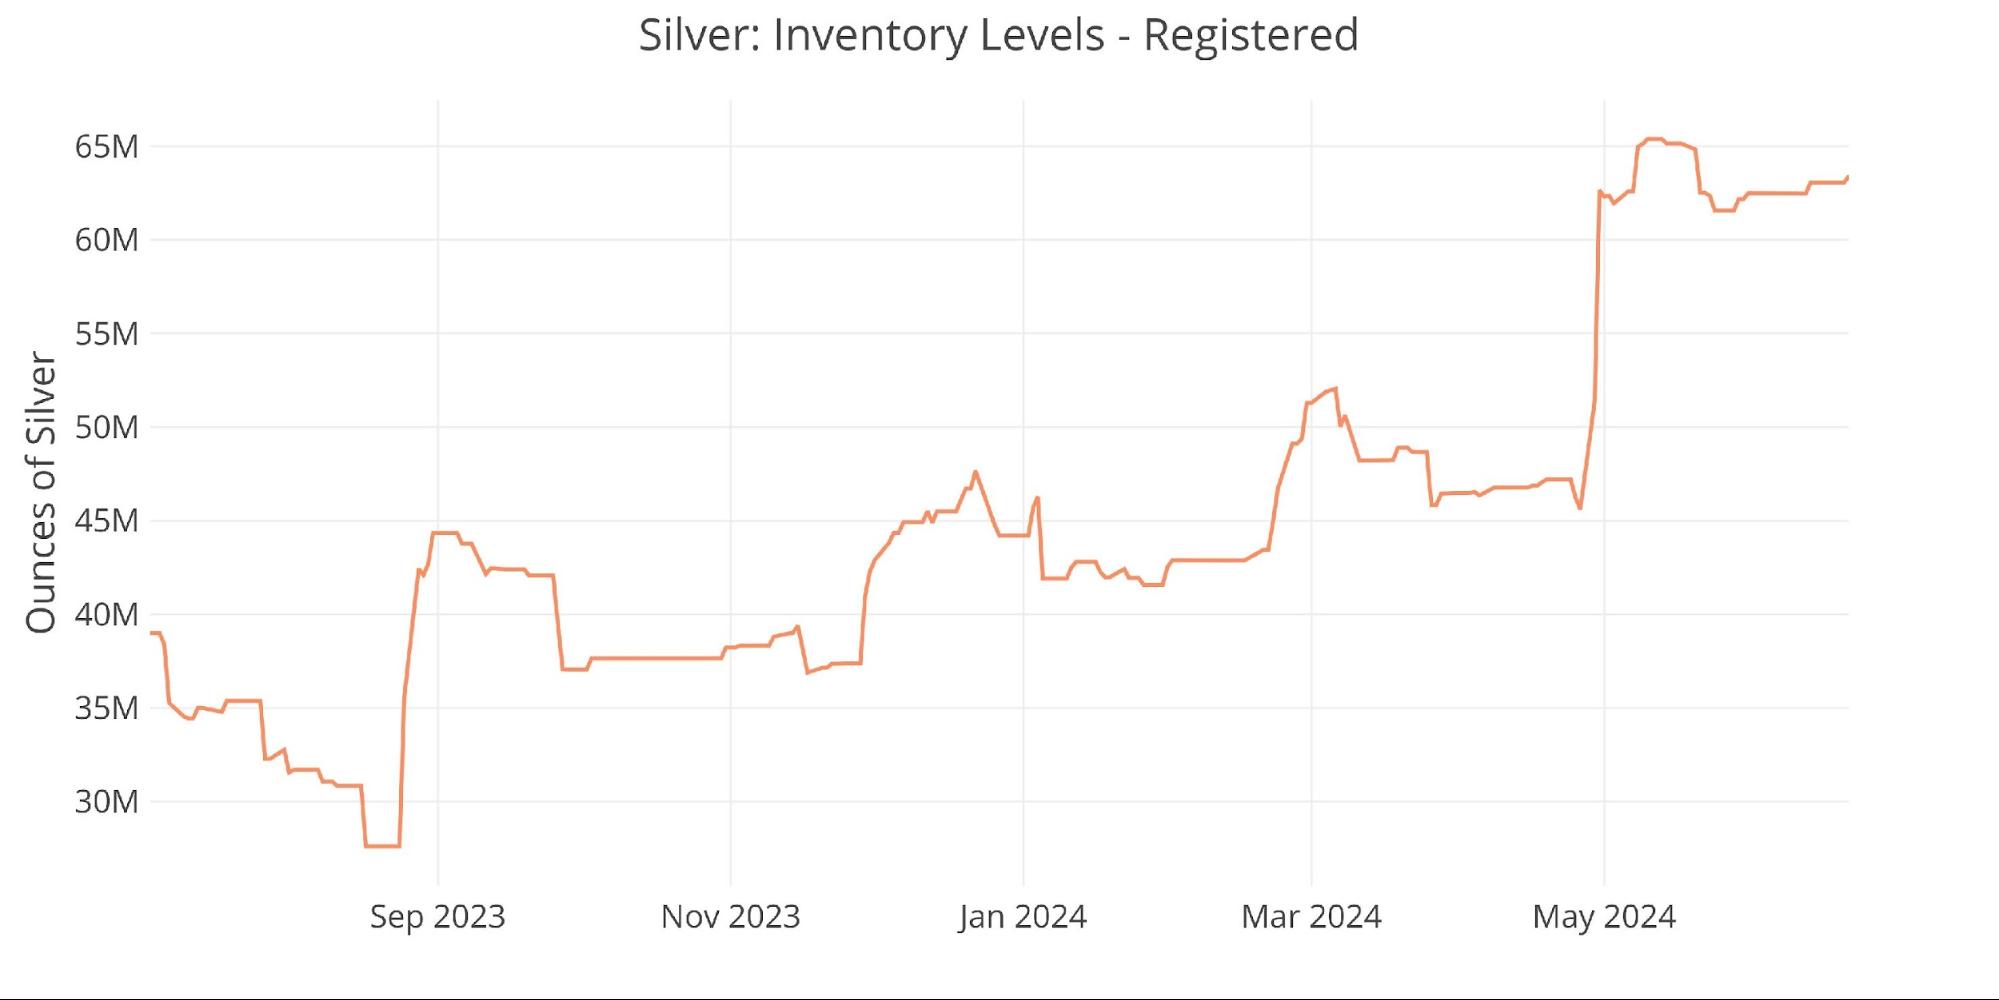
Figure: 9 Inventory Data
As we approach the delivery period for July, you can see that the silver contract is actually well above the previous few months. This is the same action we saw in gold last month which turned out to be an early sign for massive delivery volume.
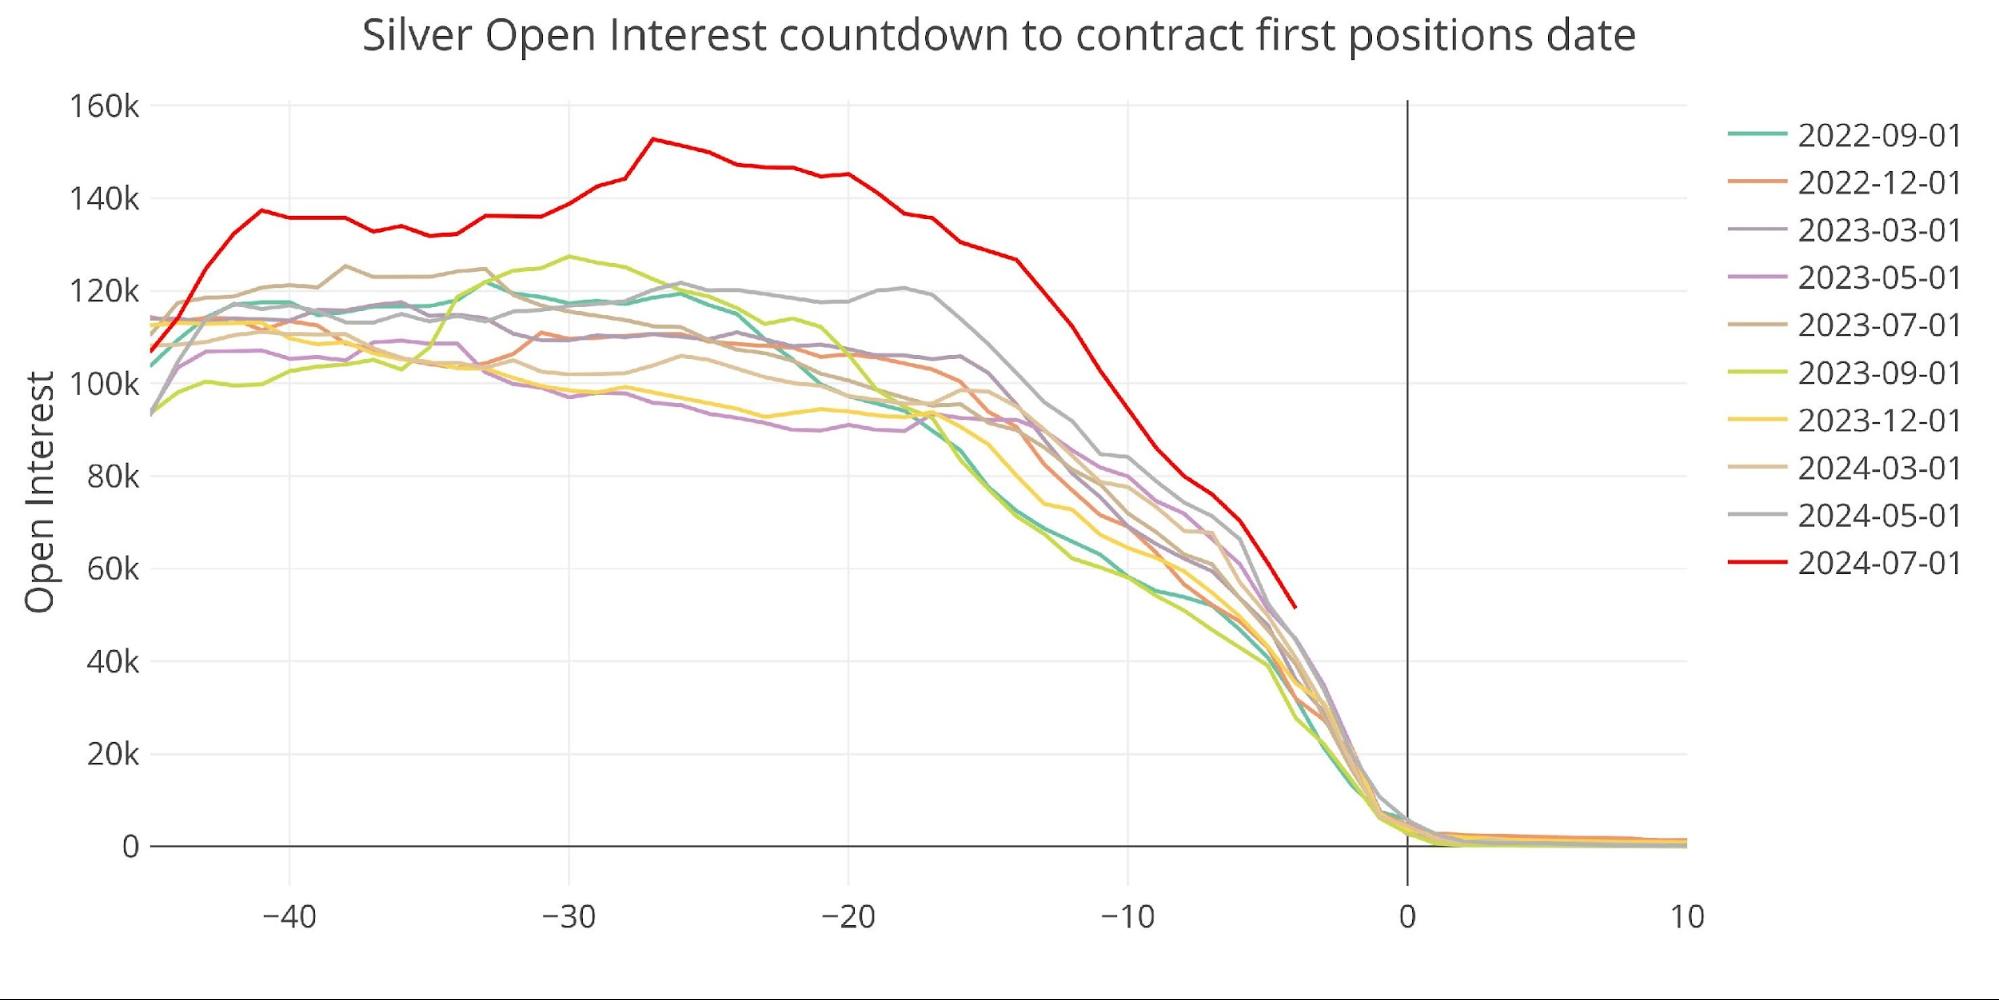
Figure: 10 Open Interest Countdown
On a relative basis, it is actually well below trend because of the massive influx of metal into Registered that occurred in May.
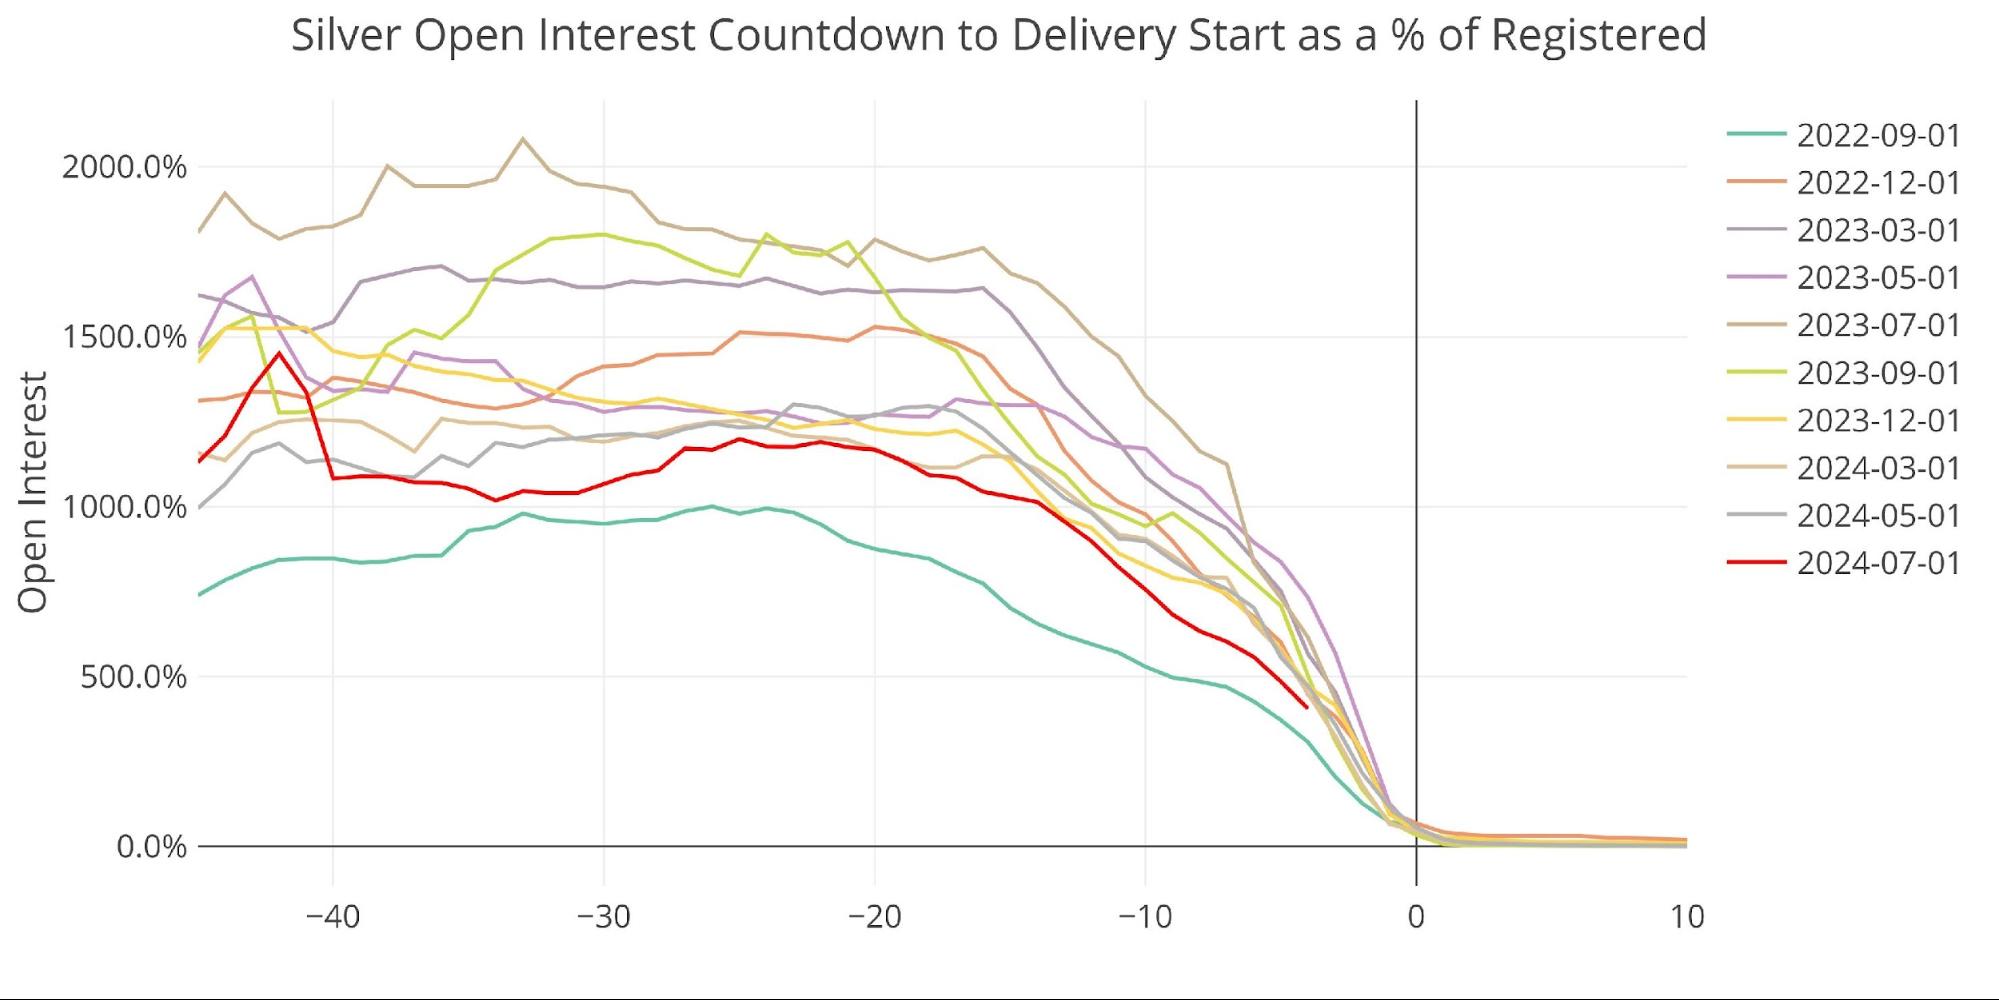
Figure: 11 Open Interest Countdown Percent
Conclusion
With gold seeing massive delivery volume, and silver poised to do the same, it appears that more people are taking delivery of physical metal despite the higher prices. This shows a lot of strong demand in both gold and silver which should keep prices elevated and may be the foundation for the next big move higher.
Data Source: https://www.cmegroup.com/
More By This Author:
Metal Of The Future? Gold‘s Uses In TechnologyGold And Governments Move In Right Direction
Gold’s Natural Scarcity Propels Its Valuation Growth


Comments
Log in or sign up to join the conversation.