
CFTC: Hedge Funds Cover Brief Net Short Position In Silver

Please note: the COTs report was published 6/3/2022 for the period ending 5/31/2022. “Managed Money” and “Hedge Funds” are used interchangeably.
(Click on images to enlarge)
Gold
Since the peak on March 8, Managed Money has massively reduced its Net Long positions by 98k contracts or 66%. Despite massive selling, the gold price has actually held up fairly well. The last time Managed Money net longs dropped this low in February, gold was struggling at the $1800 level, versus the struggle at $1850 now.
Total Net Longs now sit at the lowest level since Sept 28 when the gold price was around $1735. Again, this shows the price has held up fairly well in the face of strong selling pressure.
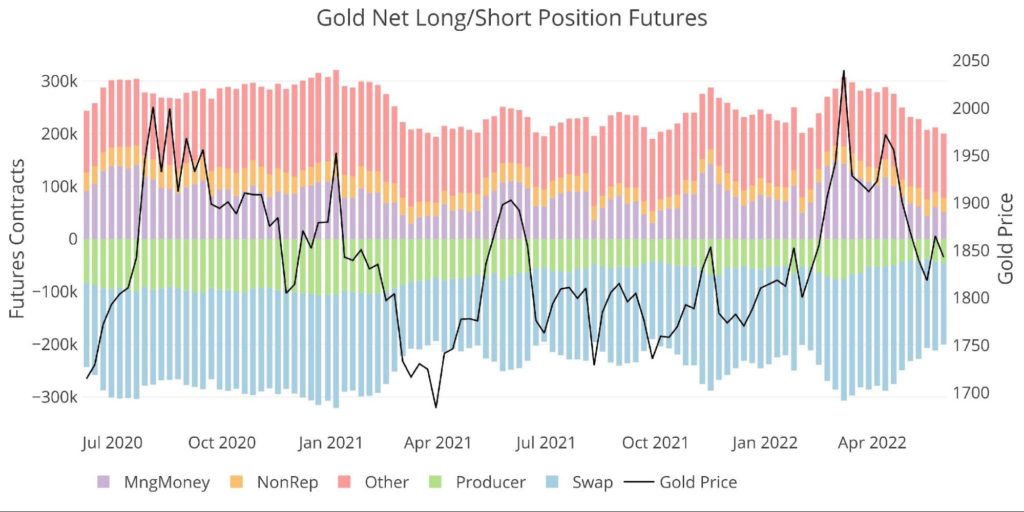
Figure: 1 Net Notional Position
The chart below focuses on only Managed Money. It shows how closely the price of gold follows the activity of Managed Money. Except for the summer of 2020, Managed Money correlates extremely strongly with the gold price. This chart also shows that Managed Money has been dumping gold at a very steady pace for three months.
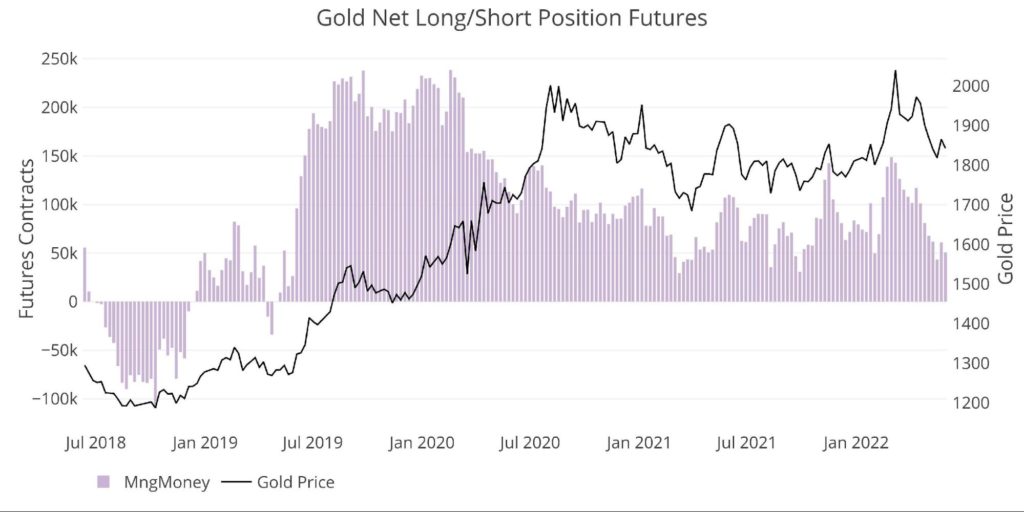
Figure: 2 Managed Money Net Notional Position
Weak Hands at Work
The weekly chart shows that despite very consistent selling pressure, it has not been as extreme as in the past. The biggest net reduction was 20k on April 26th. Before the recent sell-off, big down weeks could see a more than 50k contract reduction.
This sell-off has been slow and steady, which is probably responsible for the price holding up better than in the past.
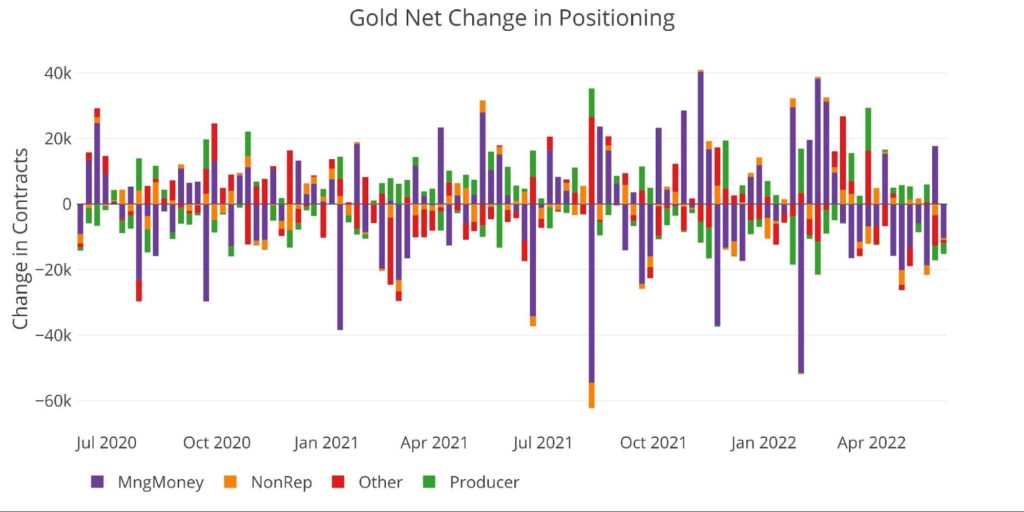
Figure: 3 Silver 50/200 DMA
The table below has detailed positioning information. A few things to highlight:
- Managed Money Net Long change was driven mostly by long liquidation over the last month
-
- Shorts only added 5k contracts against Longs liquidating 25k contracts
-
- Other is down 11% over the last month for the same reason
-
- Shorts fell by 400 contracts where Longs fell by 18k contracts
-
- As typical, Swaps are on the other side, reducing shorts by 50k contracts over the last month
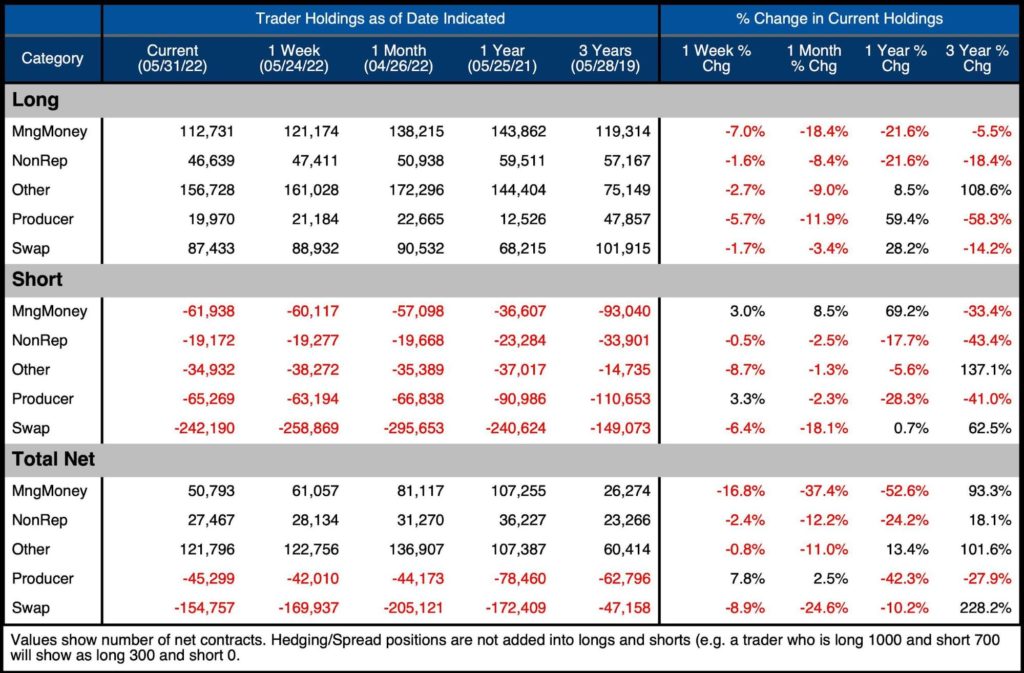
Figure: 4 Gold Summary Table
Historical Perspective
Looking over the full history of the COTs data by month produces the chart below (values are in dollar/notional amounts, not contracts).
Three major takeaways:
- Other Gross Long has increased more than 3x since 2019 ($9.5B in May 2019 vs $29B in the latest period)
- Swap Gross Longs are still near the highest position since Feb 2020 just before Covid hit
- Swap Gross Shorts are down since their record peak in March (-$62B vs -$44B)
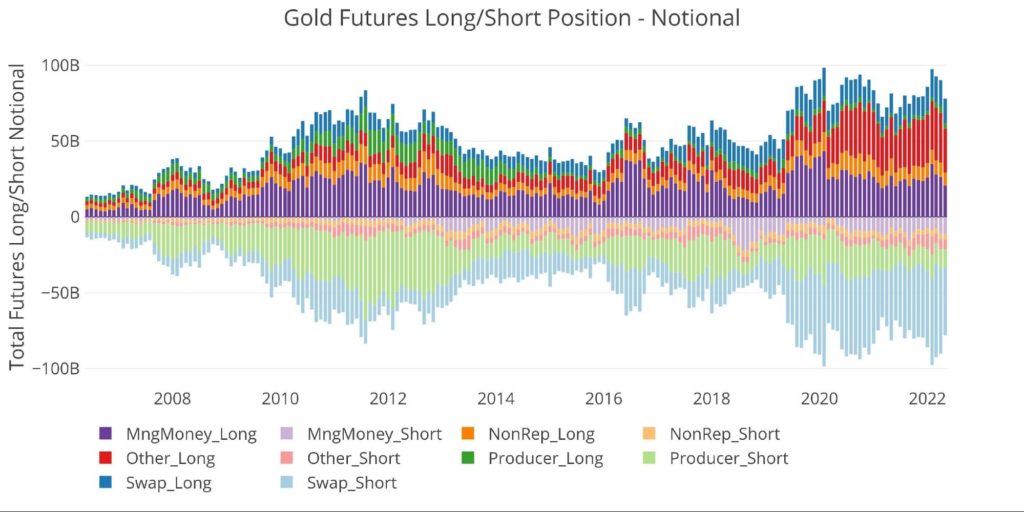
Figure: 5 Gross Open Interest
The CFTC also provides Options data. This has mainly been dominated by Producers, but recently Managed Money has played a larger role within the market. The current period shows Managed Money Gross Longs at $2.4B which is down $7.5B from the peak in July 2020 when it hit $10B.
Producer Gross Option Shorts have dropped to the lowest level since June 2019. Producer Gross Option Longs ($1.3B) are at the lowest level since July 2009 ($1.1B). For perspective, this number stood at $14B in July 2020.
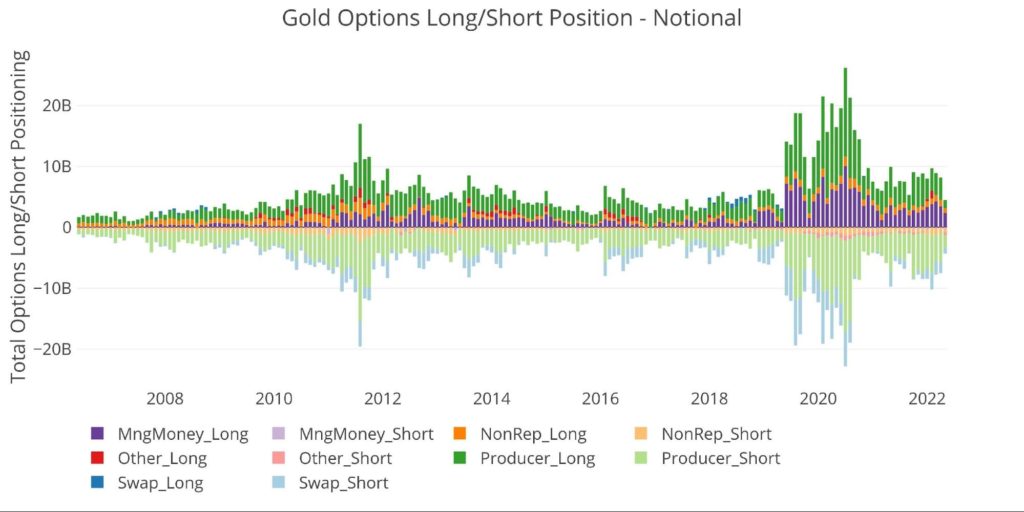
Figure: 6 Options Positions
The final chart below looks at net notional positioning against price over a longer time frame. As mentioned, while the correlation of Managed Money is strong, it is not perfect. The long-term bull market continues despite the volatile gyrations of Managed Money positioning.
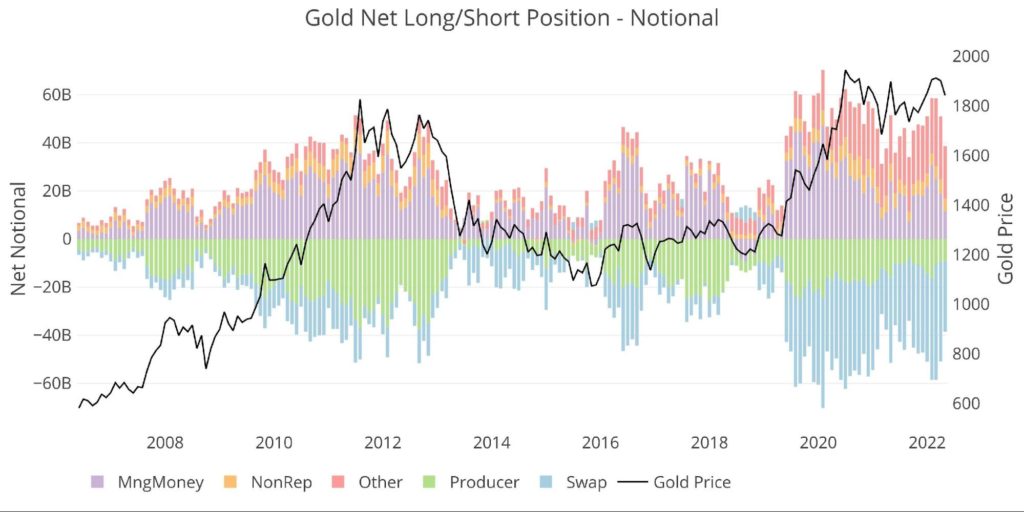
Figure: 7 Net Notional Position
Silver
Current Trends
Silver has seen an incredible collapse in Net Long positioning for Managed Money. Since the 48k peak on March 8, Hedge Funds are now only Net Long by $3k. Last week, net positioning was short for the first time since June 8, 2019!
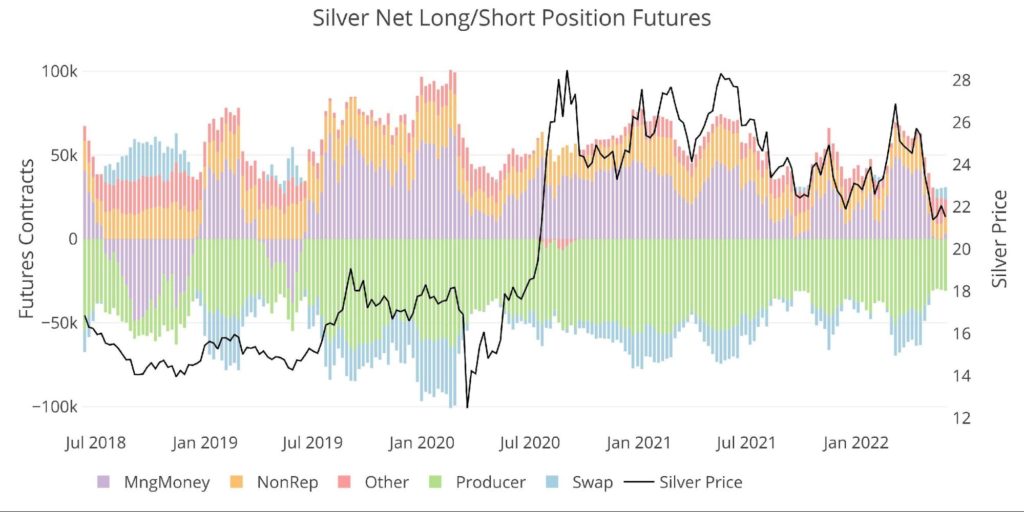 Figure: 8 Net Notional Position
The chart below shows the relentless selling over the last two months. The latest week finally saw a bounce back as shorts covered their positions.
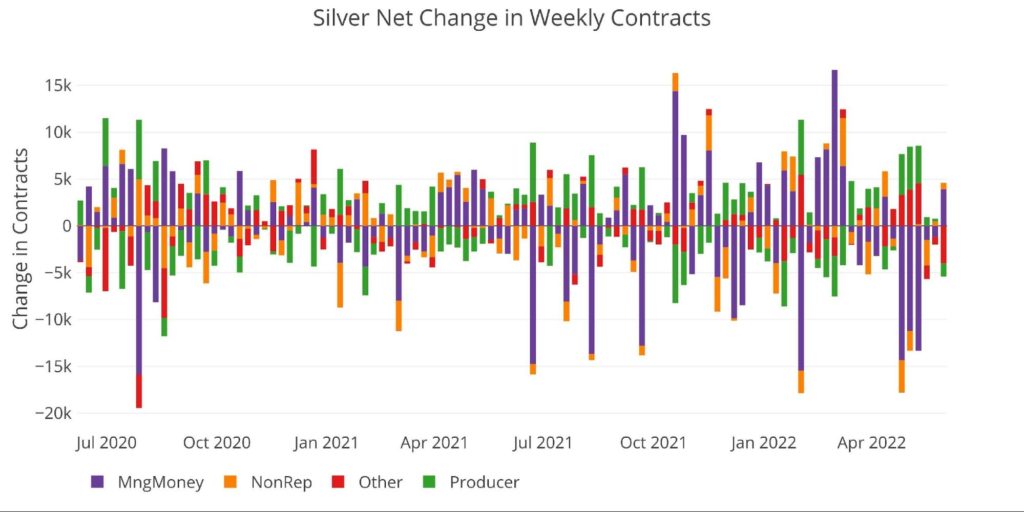
Figure: 9 Net Change in Positioning
The table below shows a series of snapshots in time. This data does NOT include options or hedging positions. Important data points to note:
- Managed Money activity has been driven by the short side
-
- Gross Longs have dropped less than 4k contracts since last month
- Gross Shorts more than doubled from 18k to 42k last week, before some covering brought Gross Shorts to 38k
- Three years ago, Managed Money was Net Short 38k contracts vs today being long 3k
-
- Swaps are at their largest Net Long positioning since June 2019
-
- Over the last month, Swaps have moved on both sides with Shorts falling 7,500 while longs increased 9k
-
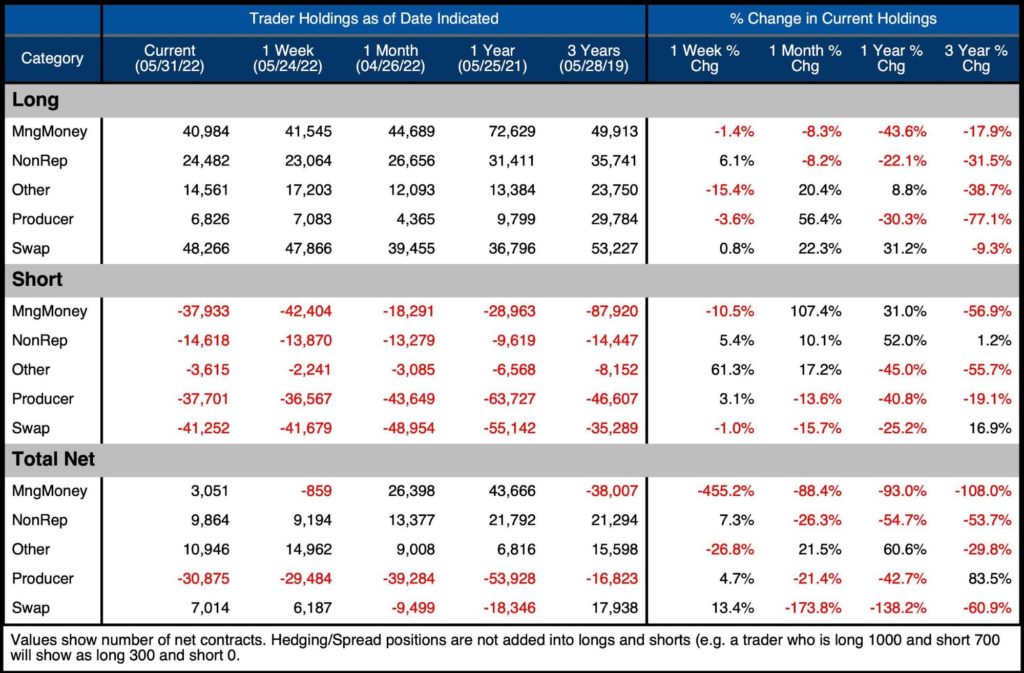
Figure: 10 Silver Summary Table
Historical Perspective
Looking over the full history of the COTs data by month produces the chart below. Unlike gold, the “Other” category has remained surprisingly stable over this time.
Surprisingly, the current Gross position is actually a bit more than November 2021. Before that, June 2020 was the last time Gross Longs stood at such a low level.
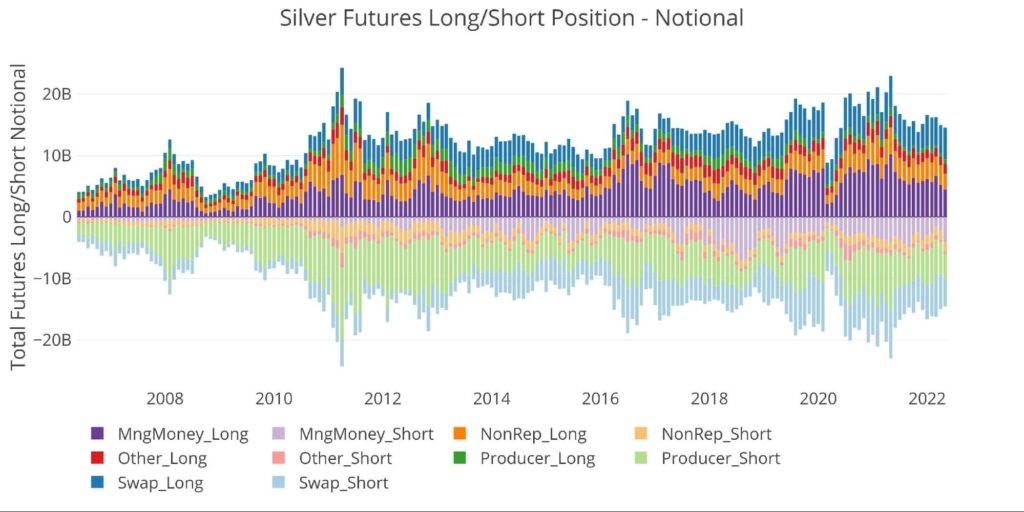
Figure: 11 Gross Open Interest
The Option market is significantly smaller than gold with Non-Rep dominating the group with $217M long and $141M short. The next biggest long is half the size with Producers running at $104M.
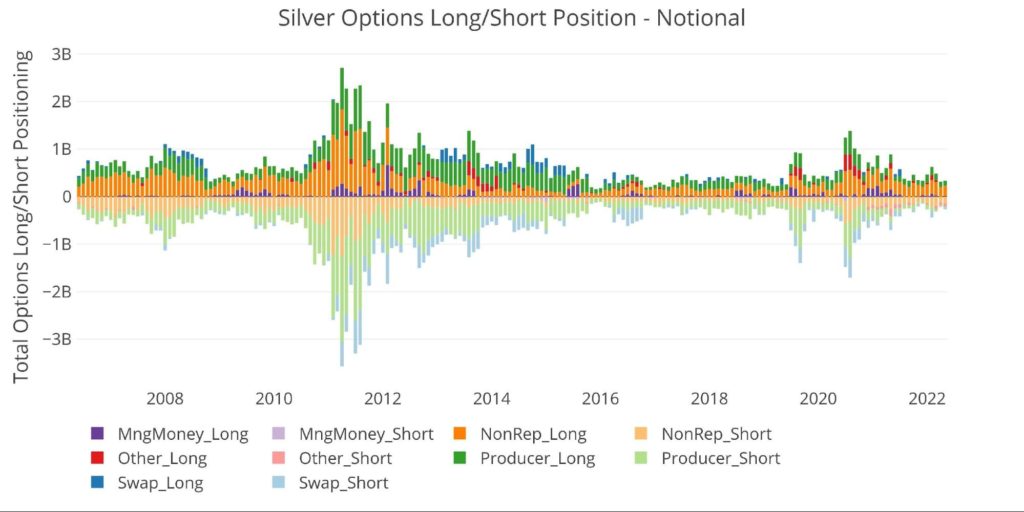
Figure: 12 Options Positions
Finally, looking at historical net positioning shows the correlation of Managed Money positioning with price. In the smaller silver market, the swings are far more volatile than seen in gold.
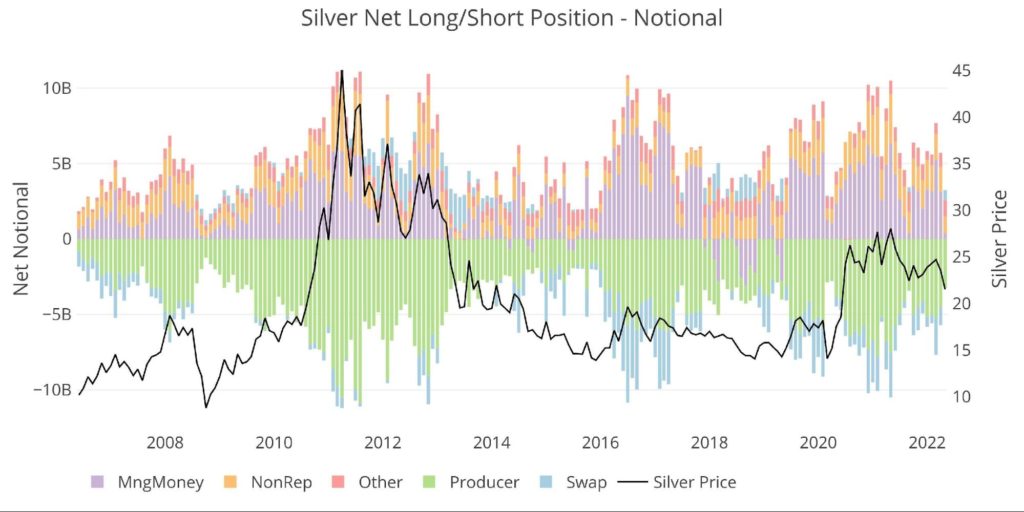
Figure: 13 Net Notional Position
Conclusion
Based on the correlation table below there is no doubt the influence of Managed Money on the price of both metals. They tend to push and pull the price around very erratically. The correlation has weakened some in gold in 2022 but remains extremely strong in Silver.
Other is pretty much the opposite, with a negative correlation in silver of -0.88 (extreme inverse correlation). This compares to a very weak correlation in general for Other gold.
It’s very interesting to note that over a longer period in gold, Other has a much stronger correlation while Hedge Funds show no correlation. This makes sense because Other has more patiently ridden the bull market while Hedge Funds are continuously getting on and off the train.
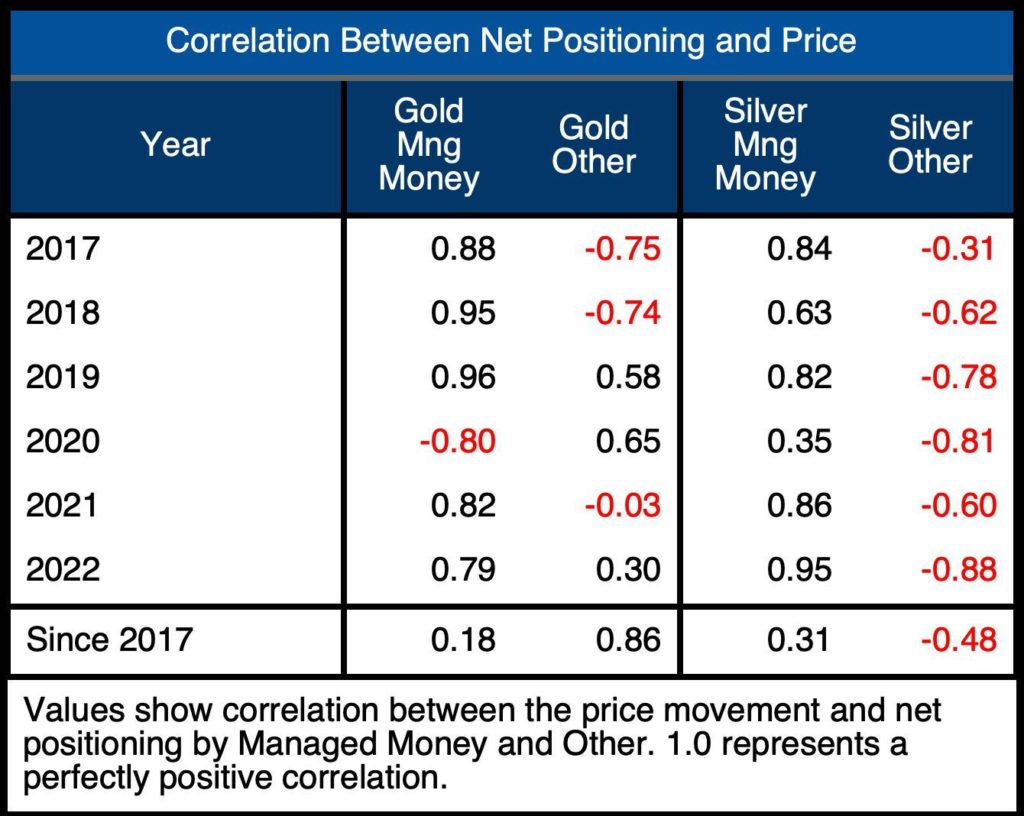
Figure: 14 Correlation Table
As Hedge Funds have dumped gold and silver at a rapid pace, the price continues to hold up. Gold is starting to carve out a stronger base near $1850/ Silver has not held up as well but still sits comfortably above the $20 psychological support zone.
The gold correlation chart is a great way to think about the market. Hedge Funds are highly correlated over short periods but completely miss the big long-term moves. Other has a poor track record over the near-term but dominates the long-term correlation.
Anyone who truly understands the precarious nature of the US economy and the impossible balancing act coming from the Fed should recognize the value of gold and silver. They should not try and time moves like Hedge Funds but instead take their cue from the “Other” category which clearly has the long-term view in mind.
Data Source: https://www.cftc.gov/MarketReports/CommitmentsofTraders/index.htm
Data Updated: Every Friday at 3:30 PM as of Tuesday
Last Updated: May 31, 2022
Gold and Silver interactive charts and graphs can be found on the Exploring Finance dashboard: https://exploringfinance.shinyapps.io/goldsilver/


