
Can Gold Prices Reach As High As $2,300 In 2021?
In May 2021, gold prices increased immensely which confirmed the mega bull flag. On yearly charts, the upper levels depict a possibility of gold reaching $2,300 in 2021. Let’s go through the technical scenario that can make gold prices hit $2,300.

Image Source: Pexels
Evaluation of Gold Market
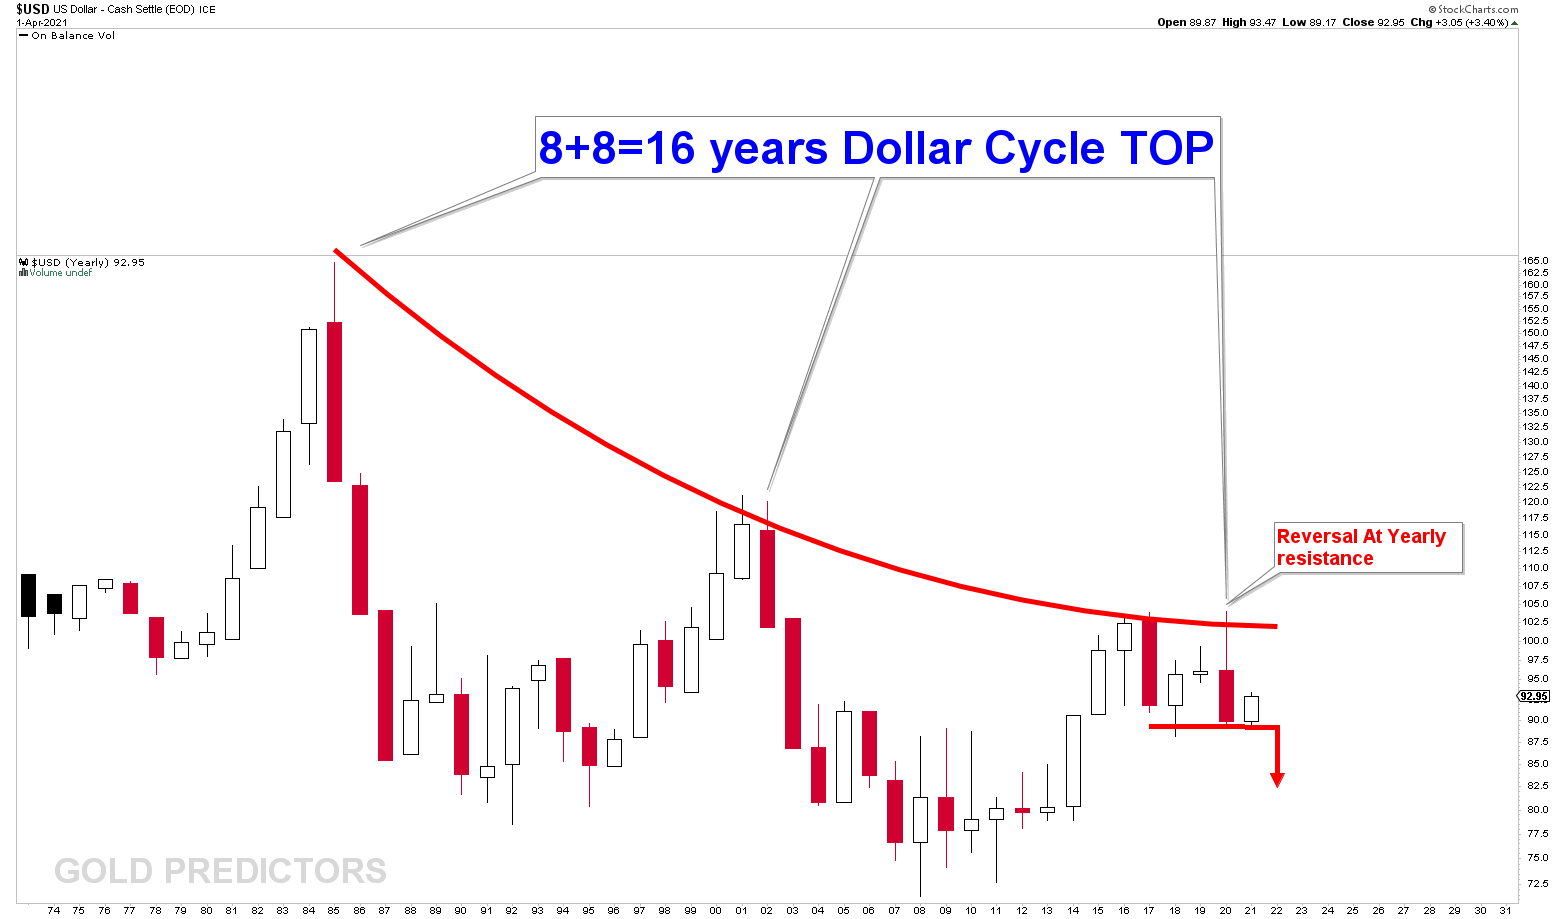
To understand how the US dollar value changes, let's first understand the yearly US dollar chart that is shown below. In the chart, each year is represented by a candle.
US dollar prices work in a cyclic manner. The decline in 8+8=16 manner develops a top in every 16 years. After every 16 years, the US dollar price reaches its highest point and then declines for the next 8 years continuously. If we observe the declining curve we will come to know that 2020 was the year of a great hit at the falling curve resistance. 2020 candle represents a reversal candle that depicts that the US dollar would crash sooner than later. And such crash scenarios usually lead to an increase in gold prices.
(Click on image to enlarge)
Let’s see USD monthly chart to comprehend the crash scenario better. For the last 10 years, USD has been trading in the blue channel. The yearly reversal of the USD created an M top scenario. In the picture below the red dotted line shows the neckline of M top. When horizontal support and channel support combine with the red dotted line, they produce a strong magnet. If this support is breached, the USD value may decline.
(Click on image to enlarge)
.png)
The below chart shows the long-term gold outlook. It has grown CUP and HANDLE which show the strong bullish case. The neckline colored red is a huge challenge for the market. This neckline represents 40 years of development (1980-2021). And a break in this neckline will certainly lead to panic and exhaustion in the commodity market. You can see a bubble directly above the red neckline in the 2021 cycle top. A bubble is produced whenever a price moves in the neckline. In 2021, gold is expected to go into this neckline once again.
(Click on image to enlarge)

Below is the zoom out view of the same chart. In this chart, the spikes that move above the red neckline reach the exhaustion line. In 2021, so far, the red line approaches at $2,120 and the blue exhaustion line kiss $2,250.
(Click on image to enlarge)
.png)
What did we predict by the end of 2020?
As per the prediction, Gold has to fall in the first quarter of 2021 to hit the diverged cycle of 10th March 2021 on a yearly inflection of 1675 to 1680, which was measured on 9th March 2021. The chart was first examined in November 2020. Price is now following the red arrow which now comes in the region $2300 in 2021.
(Click on image to enlarge)

The following year, gold hit the yearly inflection of 1680-1675 on the diverged cycle of 10th March 2021. The bullish case was confirmed with a double bottom on the yearly inflection of 1675-1680. Since prices have breached 1792 on weekly basis, the gold market has to evaporate for the remaining period of the year 2021. In the chart illustrated below, the ascending broadening pattern overlaps with the long-term targets of 2120 and 2250.
(Click on image to enlarge)

The chart below illustrates the moving averages of 10 and 20 months. It is observed that gold generates the bottom on the moving averages. If the last bull phase starting from 2000 to 2011 is observed, the gold market kiss six times at 20 months moving averages. Therefore, it creates around 6 buying opportunities on a long-term basis. In the very current bull phase of the gold market, which started in 2019, the moving average was actually kissed for the third time in March 2021. A breakout above the value of $2,300 can induce market evaporation and panic because these are the 40 years of gold markets breakout.
(Click on image to enlarge)

Is there any chance of gold breaking $2,300?
A quarterly log chart is used to show whether gold will break $2,300 or not. As the below chart shows, gold reached breakout levels in 1923.73 during the third quarter of 2020. If we consider the growing patterns of CUP and HANDLE, we will come to know that the breakout in the gold market may create panic buying. And the breakout numbers remain within the range of $2,120 and $2,300. As these are long-term charts, so big deviation of $200 is allowed on both sides of the gold market.
This chart helps in identifying the level of similarity between breakouts that happened in the past. You can see that the same reaction was observed when prices reach the highest points in 1978 and 2007. An increase of 743% in the gold’s value was seen during the 1978 breakout and an increase of 659% was seen during the 2007 breakout. If you calculate the average 700% gains by using long-term cycle bottom (8 years cycle bottom), then there is a possibility for gold to hit $8,000 per ounce.
(Click on image to enlarge)

What if gold does not break $2,300
By using long-term charts, you can observe the importance of price levels. It shows the possibility of gold not breaking $2,300, rather continuing to trade sideways. If a breakout around 2100 and 2300 regions does not happen, prices will once again fall back. Then the pivots will be calculated with the help of chart mining and complex calculations. No matter which scenario occurs, the long-term resistances, which we have already talked about in this article, are big.
Markets related to gold
A correlation between gold and other forms of commodities always exists. Whenever you are analyzing facts and figures then it is important to keep this correlation in mind. So far we have come to know that gold and USD are inversely proportional to each other. If one rises the other falls. But under some circumstances, the opposite can happen too. Euro and Japanese yen also have their own correlation with this yellow metal.
A chart was created to find the actual relation between USDJPY and gold when prices of gold were going to hit the inflection of 1675-1680. During the same period, it was found that USDJPY was also going to hit an inflection.
(Click on image to enlarge)

(Click on image to enlarge)

EURUSD and USD are inversely proportional to each other which creates one more correlated market. EURUSD is not reaching high because USD has trading long-term key inflection points. The gold market may get exhausted due to the establishment of the euro more and the development of pressure on the USD.
(Click on image to enlarge)
.png)
Final Words
According to the technical charts shown above, the gold market has bottomed on a diverged cycle of March 10th on a yearly inflection of 1675-1680. Following the double bottom at 1680, a weekly breakout above 1792 suggests that prices will rise to $2300 by 2021. However, the 40-year neckline of CUP and HANDLE developments provide strong resistance, suggesting that prices may find resistance at the $2300 region. A clear breakout above the $2300 level in 2021, on the other hand, will cause panic and attract a large number of buyers.
Disclaimer: Material distributed by GoldPredictors.com has no regard to the specific investment objectives, financial situation or the particular needs of any visitor or subscriber. This site ...
more


It is true that there are a lot of risk factors surrounding the economic recovery in the U.S., but I wouldn't bet against it, just yet. While we will continue to see recovery growth for the remainder of the year, this does not mean we will continue to see spikes of volatility, especially in commodities. Does this mean gold at $2,300? I am not sure how reliable the historical charts are in the post-pandemic environment.
Many folks see the price of gold as being inversely proportional to confidence in the US Dollar. I am inclined to agree, since gold is usually seen as a hedge against inflation. So if gold does reach $2300 it will indicate a very unfortunate lack of confidence in the dollar. We may indeed be "doomed", whatever that means in this context.
Totally agree
Good read, thanks.
Thanks