
Big Down Day For Gold And Silver, More To Come?
After a recent spike to the upside over the past seven days, both gold and silver have turned negative again and could be headed back to their recent low points reached early in the day on Monday, November 30th.
The movement in both gold and silver is evident of a decided shift in trend direction to the downside. What happens after prices return to their recent lows could prove interesting; or downright discouraging if you are expecting a resumption of the trend to higher prices.
Silver at its recent reaction high point yesterday reached $24.80. At that point it was still down $5.00 per ounce from it August intraday high of $29.80. When silver touched $21.80 last week it represented a loss of more than twenty-five percent from its August peak.
Gold's percentage changes are more moderate but still, at its recent low of $1770, gold was down three hundred dollars per ounce from its August peak.
So, what can we expect ahead? Below is a chart (source)of silver prices for the past one hundred years...
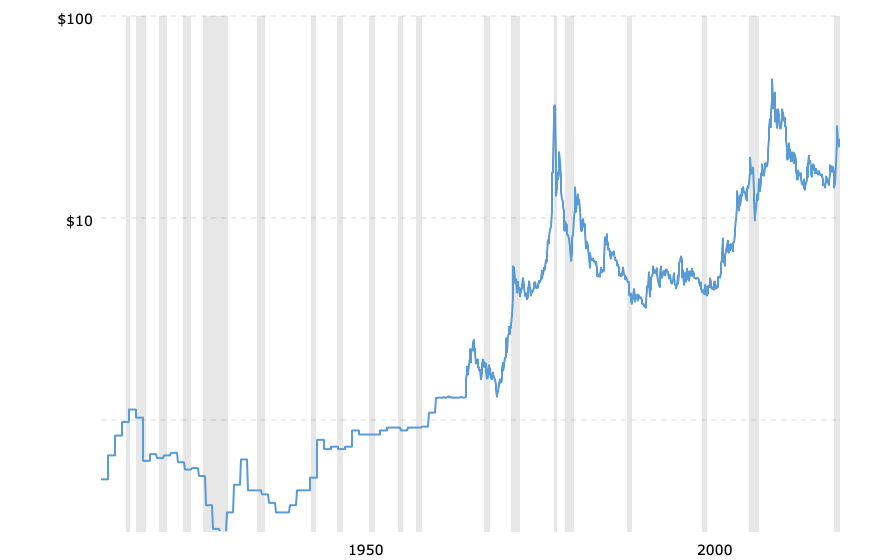
Between July 1982 and April 1983, a period of only nine months, the price of silver tripled from just under $5 per ounce to almost $15 per ounce. Can you imagine the froth associated with that move?
Silver had fallen ninety percent from an intraday high of $49 per ounce to an intraday low of $4.90 per ounce over the preceding two years. What seemed like the beginning of a new uptrend in silver prices was not that at all, however.
After topping at $14.67 per ounce, the price of silver began a three-year slide culminating with a low of $4.85. That decline completely erased the tripling of prices that had occurred.
Then, silver began another "new uptrend" which took prices to almost $11.00 less than a year later. It didn't last long, though, as silver almost immediately began moving lower. Four years later in 1991, silver had broken to new subsequent lows at $3.55.
Another example of silver's "flash-in-the-pan" performance happened more recently. After reaching its price peak of $49 in April 2011, silver fell to a low of $13.70 in December 2015.
Barely seven months later, in July 2016, silver was up to $20.70, an increase of more than fifty percent. Over the next four years, silver fell forty-three percent to a subsequent new low of $11.77 in April 2020.
Below is a chart (source)of gold prices for the past one hundred years...
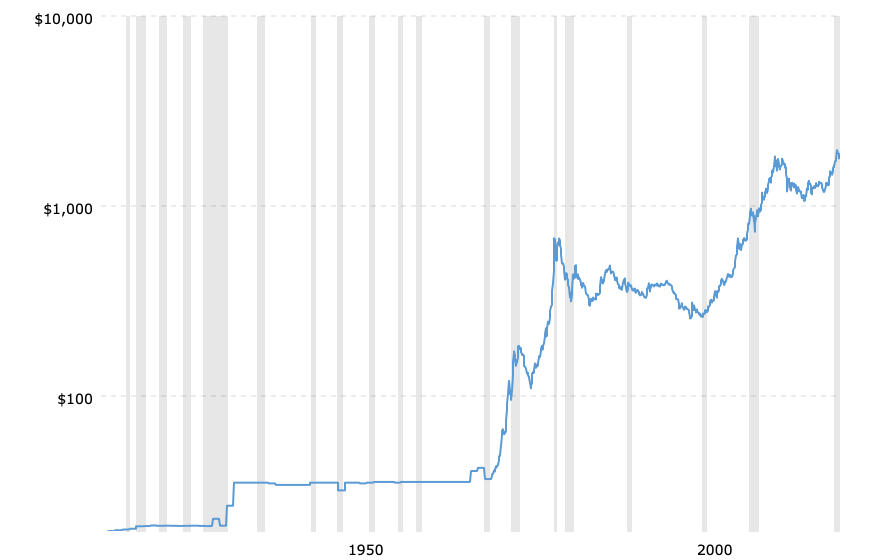
Movements in gold prices are seemingly similar to silver. Gold prices, however, do not reflect the wide-eyed fantasy that underlies most of the the bullish sentiment for silver. Since higher gold prices reflect the ongoing loss in purchasing power of the US dollar, which takes place over decades, changes in its price are much less extreme than those in silver.
CONCLUSION
When both gold and silver hit recent highs a few months ago, gold had exceeded its 2011 peak by about nine percent. Silver, on the other hand, was still down forty percent from its 2011 peak.
Historically speaking, silver's upward price spikes have been met with equally violent reactions to the downside. There are no fundamentals to support expectations for something different this time.
Since higher gold prices are indicative of declines in US dollar purchasing power that has already occurred, then there must be obvious and decisive weakness in the US dollar going forward, in order to expect higher gold prices from this point.
Kelsey Williams is the author of two books: Inflation, What it is, What It Isn't, And Who's Responsible For It and more


Gold and silver pricing appears to have an emotional component in the drive mechanism and so pricing will be variable. As optimism rises the seeking of stable bases will tend to decline. While this is certainly reasonable it is not as predictable as some would find profitable.