
Bakken Update: Rig Counts Tell Us Little As Horizontal Production Has Changed The US Oil Market
I have said on multiple occasions that rig counts aren't necessarily the best way to follow the health of the US oil markets. The oil price pullback forced many operators to drill a bunch of holes. These holes were left uncompleted and named the US fraclog. Operators put capital to work and prepared for the return of higher oil prices. I don’t think anyone saw how long and drawn out it would be, nor did operators think they would be sitting on this large a number of uncompleted locations. With such a large number, many operators have dumped the majority of rigs and are just focusing on the best core leasehold. These wells are profitable at today’s prices, but much of the fraclog is not. In states like North Dakota there is a limit to how long a well can sit uncompleted, but it changed those rules to help operators through this difficult time.
Companies that provide drilling rigs have been hit especially hard. There may not be a light at the end of the tunnel, as we continue to see utilization and rates struggle in today’s environment. Although rig numbers had been a very good indicator as to the health of the US oil industry, things may have changed. Forty years ago the majority of locations drilled were conventional wells. An operator would drill to the depth of either oil or natural gas. This was a much easier and cheaper way to collect resource. Less complex rigs are needed to drill vertical wells, and those rigs are seeing a decreased demand. When conventional production provided the bulk of US oil production, rig numbers were much more important. One could derive production numbers based on this, but today this is much more difficult.
Conventional production declines differ from new horizontal wells. When a conventional well begins production, less is seen upfront. A typical conventional well will also exhibit less upfront, but provide reliable numbers with less decline. A conventional well will begin production and immediately see an approximate 4% decline rate. These wells will produce for decades, until production dips to a point where it is uneconomic. At that point, it becomes a stripper well. Keep in mind, some wells will be shut in, but if oil prices increase may start producing again. Horizontal production differs significantly. Although production declines are much larger, and a large percentage is upfront. Costs are also generally much greater. These declines differ by geology. Intervals that produce more natural gas will have greater well pressures. This means resource (including oil) will be pushed up and out of the well bore at a greater rate. It also means declines may be greater because production began with higher pressures that will decline as the well produces. The deeper the source rock, the greater well pressures will be. So although it will be more expensive to bring that well online, one would hope better pressures would decrease payback times. Because production rates differ by play and depending where in the play it is located, production increases are a little more difficult to estimate. A Horizontal well will produce roughly half of its resource at 5 years. This differs significantly by play and well design, but is a rough estimate to follow. Wells that use too little propellant or the wrong type may see faster decline rates. If the fractures created during completion are not propped open well enough, it will close and shut off production. In some plays, ceramics must be used but we are starting to see all sand fracs in all of the major plays. Operators are having good luck with sand intensive fracs that use huge volumes in horizontals that use better stimulation techniques focused near the well bore. In 2008, we saw more unconventional horizontals decline at a 98% rate over the first year. This has improved dramatically, as we are seeing some decline between 70% and 80%.
Well design is also key to production. Newer slickwater, sand intensive fracs and hybrids not only improve production, but have slowed the decline curve. The best wells to date are Mega-Fracs. These wells use anywhere from 7 to 20 million lbs of sand per two-mile lateral. Mega-Fracs use multiple points to stimulate the interval. This means more of the source rock is in contact with the well bore. This increases production per foot. These changes to well design were pioneered by EOG Resources (EOG). I have covered this topic in several articles. Operators like Continental (CLR), Halcon (HK), Devon (DVN), Pioneer (PXD), Oasis (OAS), Whiting (WLL), and Matador (MTDR) are just a few active names. The operators that began this technique early are doing better today. It is one of the reasons we are seeing very good RORs at today’s oil price.
Well design isn’t the only change in the US oil market. Development plans have also changed. Operators that were in a rush to get acreage held by production, are now looking to develop core acreage on a broader scale. Using ND as an example, rigs have moved from Burke, Divide, western Williams, western McKenzie, and Stark counties. It now resides in the Bakken core for the most part. Operators are now drilling and completing large pad projects in northeast McKenzie, southeast Williams, northern Dunn and southwest Mountrail counties. Operators save large sums of money by drilling several holes over a very short distance and then completing at the same time using the zipper frac technique. This saves an operator time, which is its most important commodity. The focus on core acreage provides more resource per well. A well in northeast McKenzie can produce 200,000 to 400,000 BO in the first year, while western McKenzie will produce less than half that. These changes have altered which types of rigs an operator will use. Most are focused on the Bakken, Permian, Eagle Ford, and STACK. This means high spec rigs are needed for deep horizontal drilling. Hemerich & Payne (HP) looks to have benefited the most, as its Flexrigs are thought of by many in the industry as the best in market.
Although HP is setting the industry standard, it is still in a very tough market.
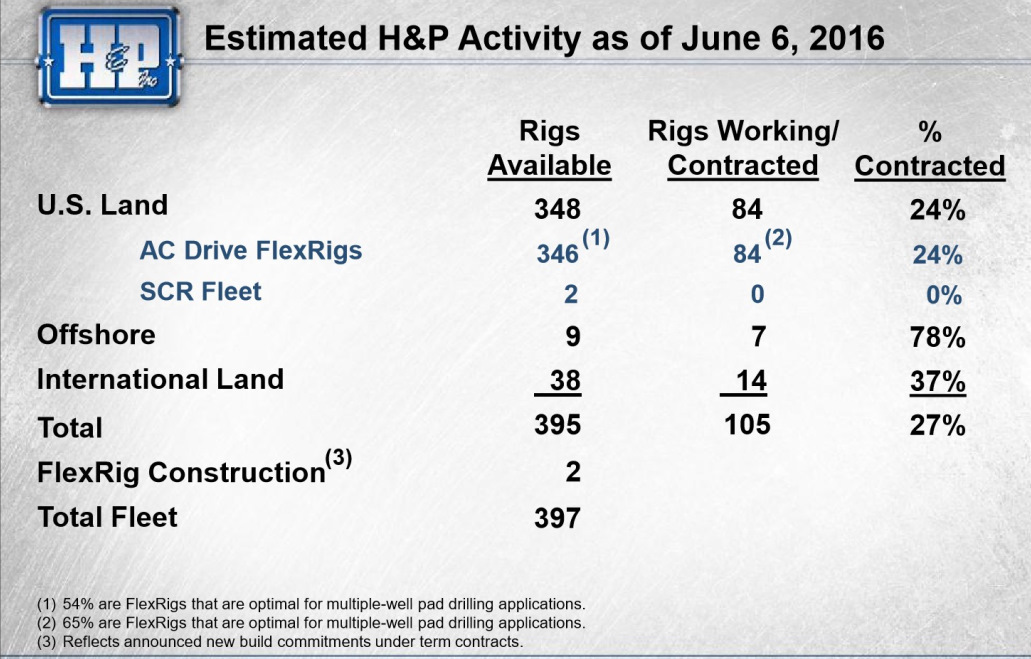
(Source: Hemerich&Payne)
It only has 24% of its rigs contracted. Although this sounds terrible, other companies are fairing much worse.
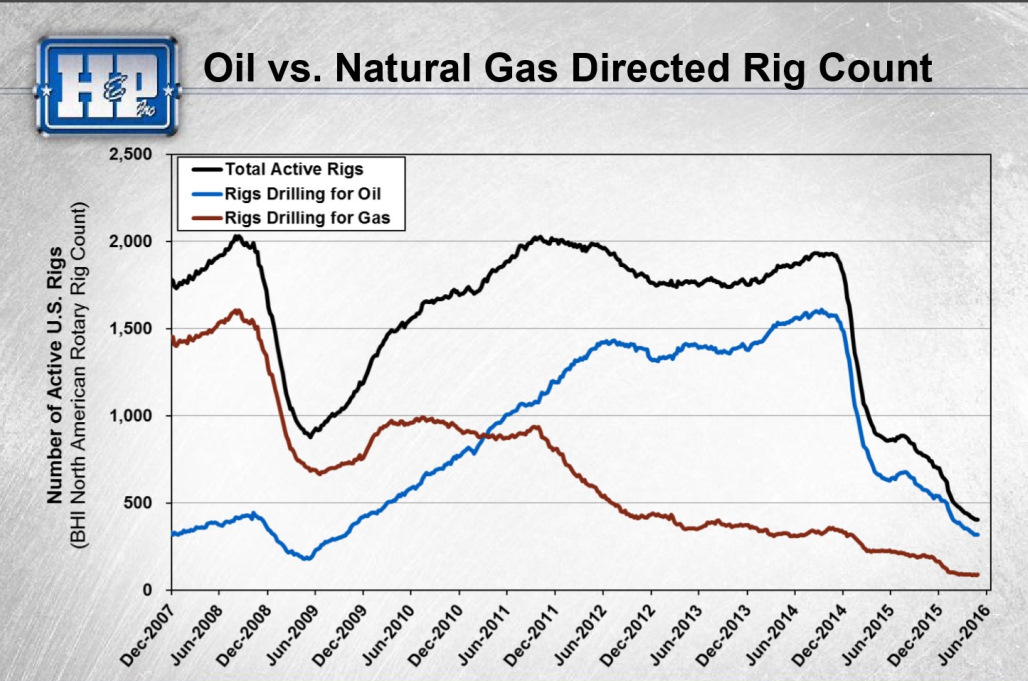
(Source: Hemerich&Payne)
Rig numbers have dropped precipitously. HP was doing well with significant Flexrig demand for oil, but that dropped just like it did earlier in the natural gas market.
Only 10% of wells currently drilled are vertical. This includes areas with multiple resource bearing intervals like the Midland Basin. In 2007, vertical wells comprised 55% of locations.
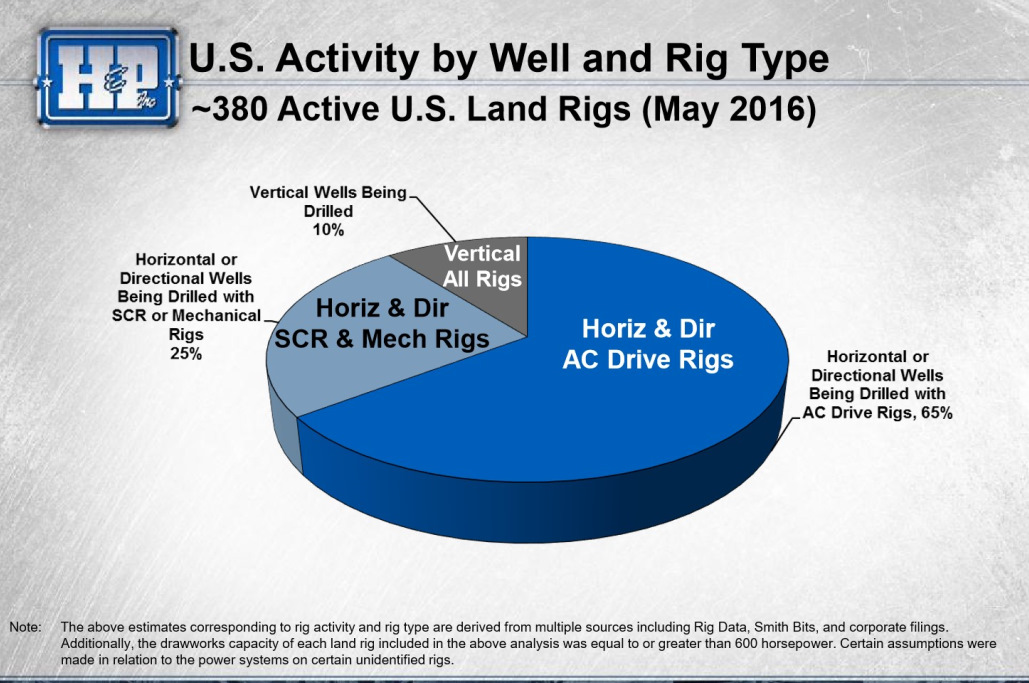
(Source: Hemerich&Payne)
65% of all wells require horizontal and directional AC drive rigs. These are the most complex. 25% of horizontals only need SCR or mechanical rigs. The industry continues to move in this direction. In 2008, 51% of all rigs used were mechanical and just 15% were AC driven. The top 10 E&P operators are currently employing 110 of all active rigs. 96% of its wells are horizontal or directional with 87% AC driven. The next top 90 operators are using 200 rigs. 8% of its wells are horizontal or directional. 65% are AC driven rigs.
(Source: Hemerich&Payne)
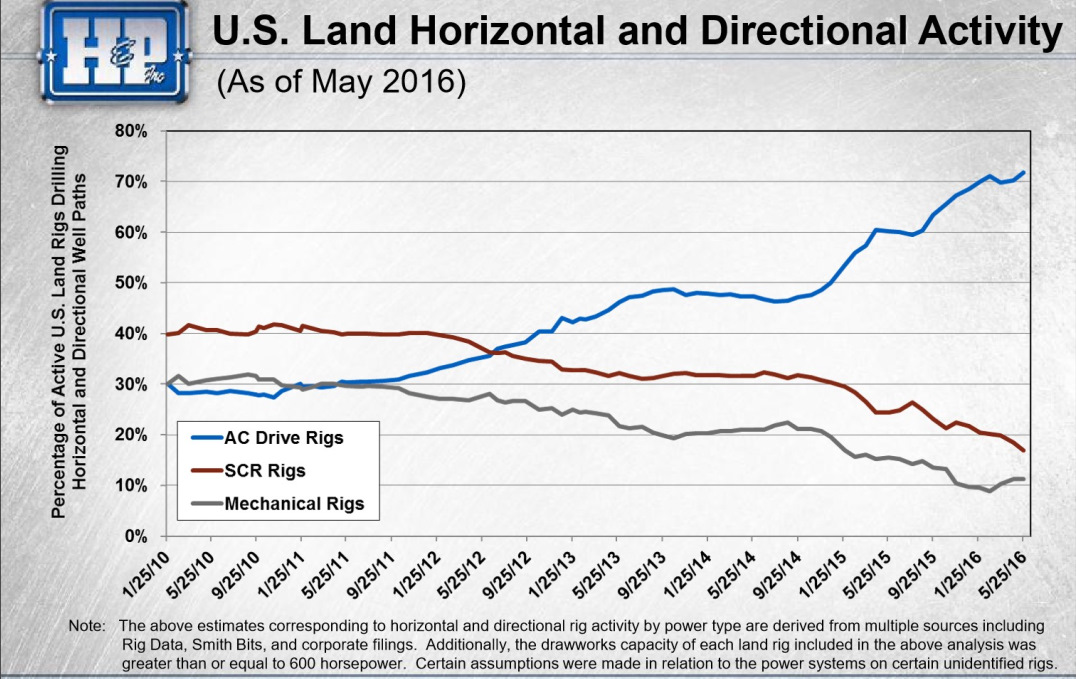
The move to AC driven rigs has been substantial on a percentage basis. Just 30% of total rig activity were AC driven in the beginning of 2010. This number has increased to over 70%. HP’s current rig activity is moving toward pads.
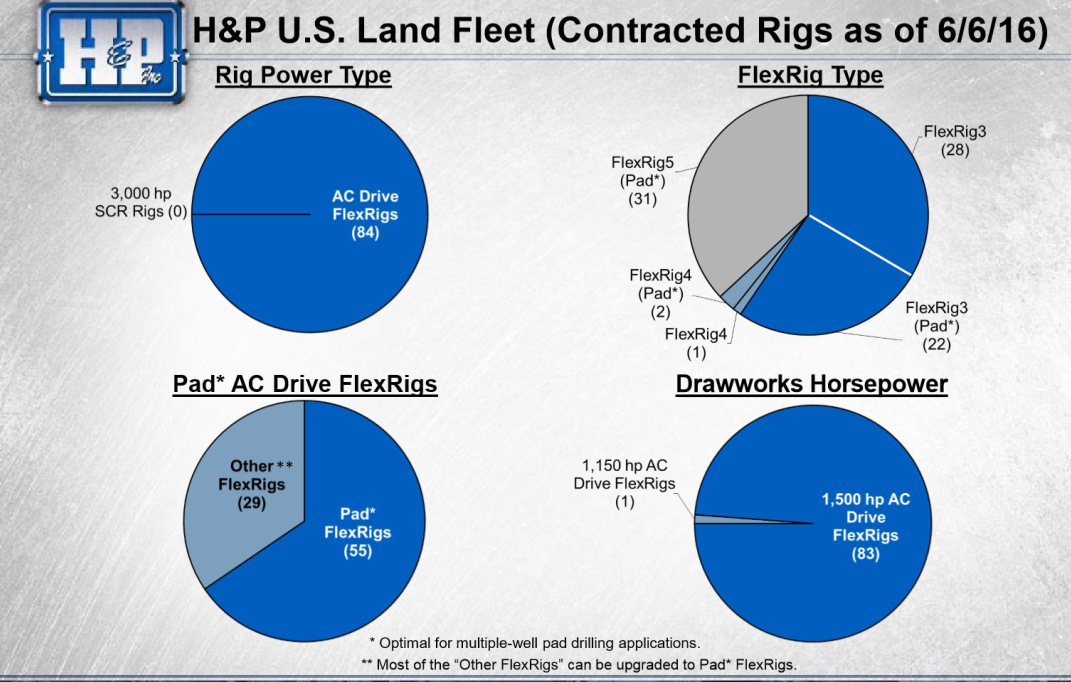
(Source: Hemerich&Payne)
55% of its deployed Flexrigs are on pads. Almost all of its contracted fleet are 1500 hp AC drive rigs. HP’s move to 1500 hp AC drive rigs are much of the reason it continues to grab market share.
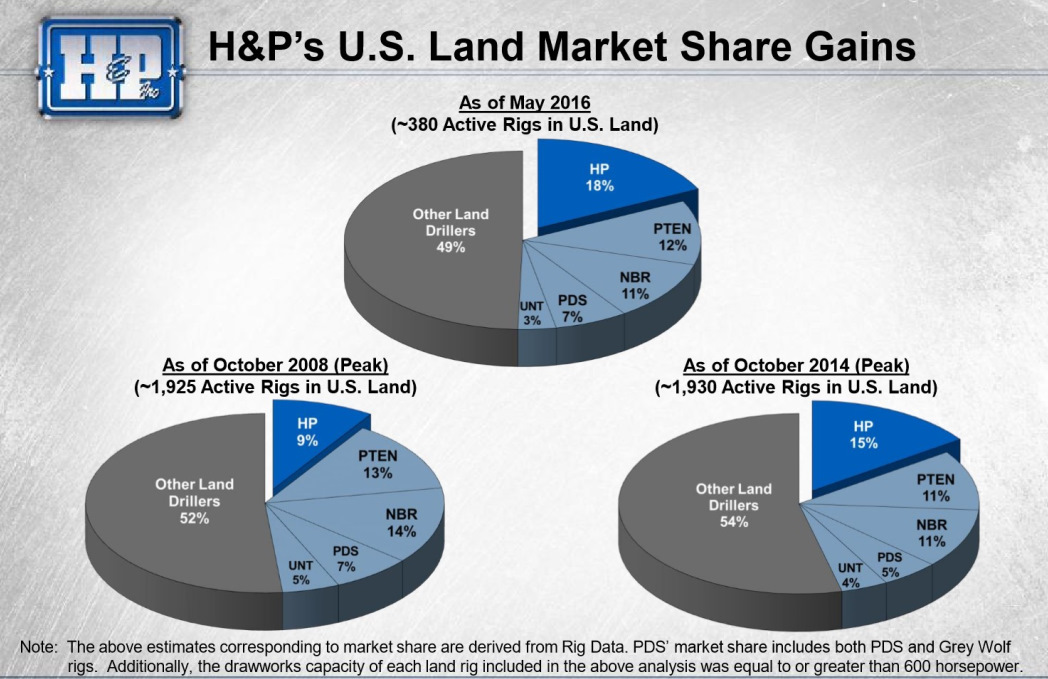
(Source: Hemerich&Payne)
When oil prices recover, HP may be in the best position to gain market share. It has a large number of Flexrigs available. Its rigs are the most popular in Texas, as the Permian and Eagle Ford dominate contracts.
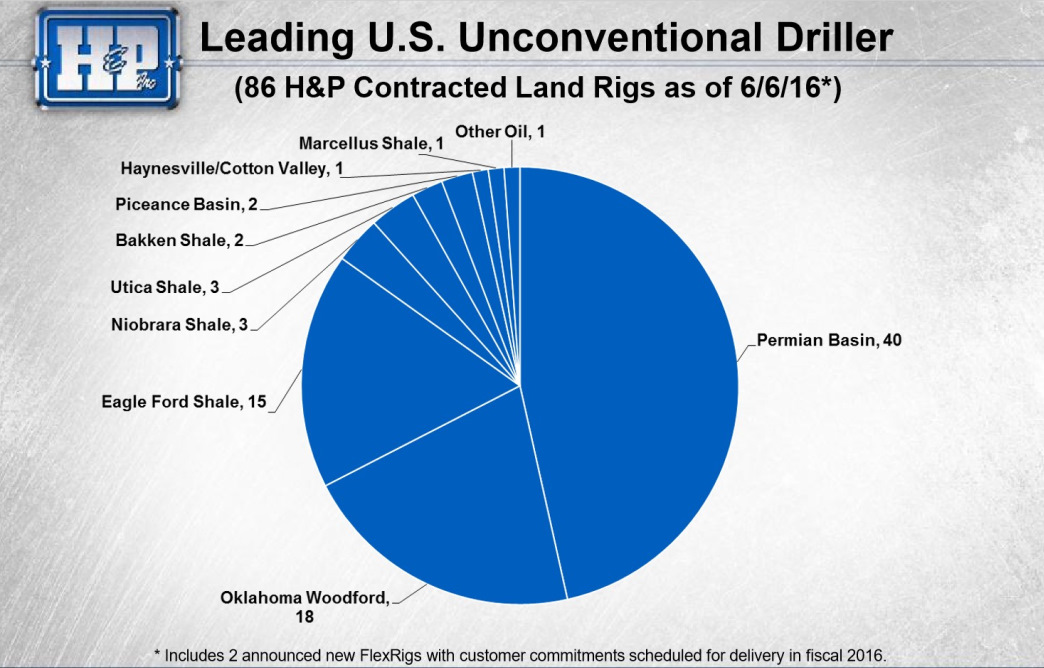
(Source: Hemerich&Payne)
Its rigs are also popular in areas with the best returns. The Permian and STACK may be the best plays in the country right now. These areas will probably see the greatest activity increases with higher oil prices.
Efficiency gains are one of the greatest issues facing today’s rig market. The improved efficiency seen through better rigs in concert with pad development could stifle any gains. This is another reason demand has waned.
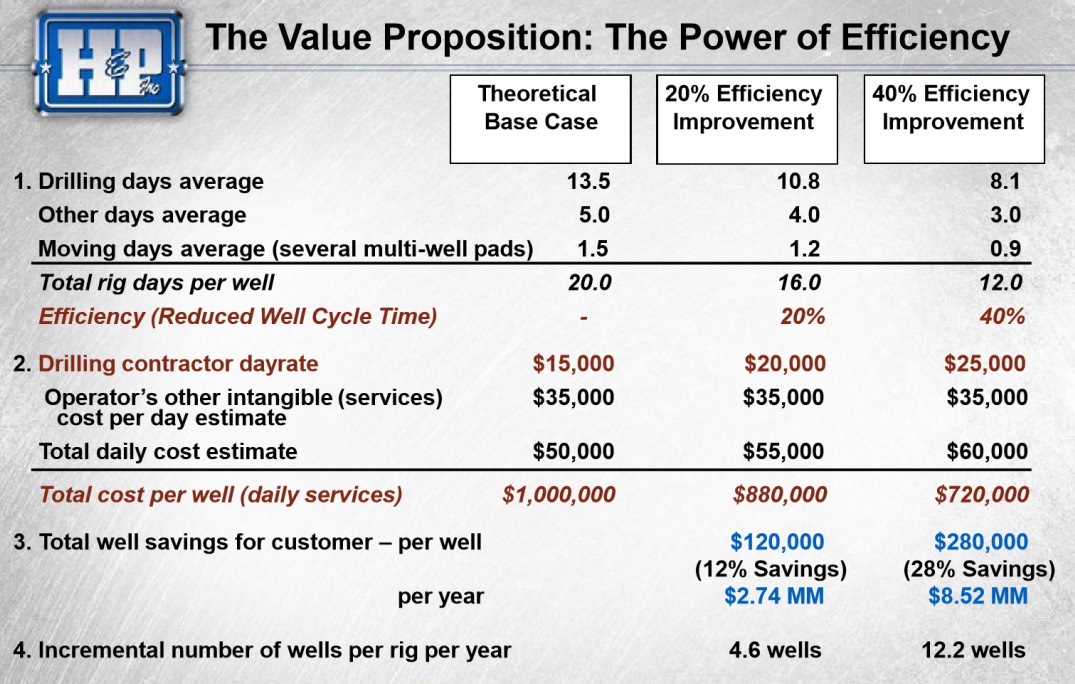
(Source: Hemerich&Payne)
Operators are realizing 10%, 20% and 30% gains in efficiency with respect to drilling days. By choosing better rigs, it is on the pad for a shorter duration. This requires fewer rigs, and if a 40% increase is seen, the operator would need just 6 rigs to do the work of 10. In theory, an operator would maintain cap ex and in turn be able to increase production estimates. This isn't the type of market we are in. Operators continue to cut in an attempt to operate within cash flows. So rig numbers would in most cases decrease. In areas like the Permian we are seeing operators like Pioneer move to increase wells, but it has the geology to support such a move. Most operators do not have this luxury.
Patterson-UTI (PTEN) has 54 of its 161 rigs contracted.
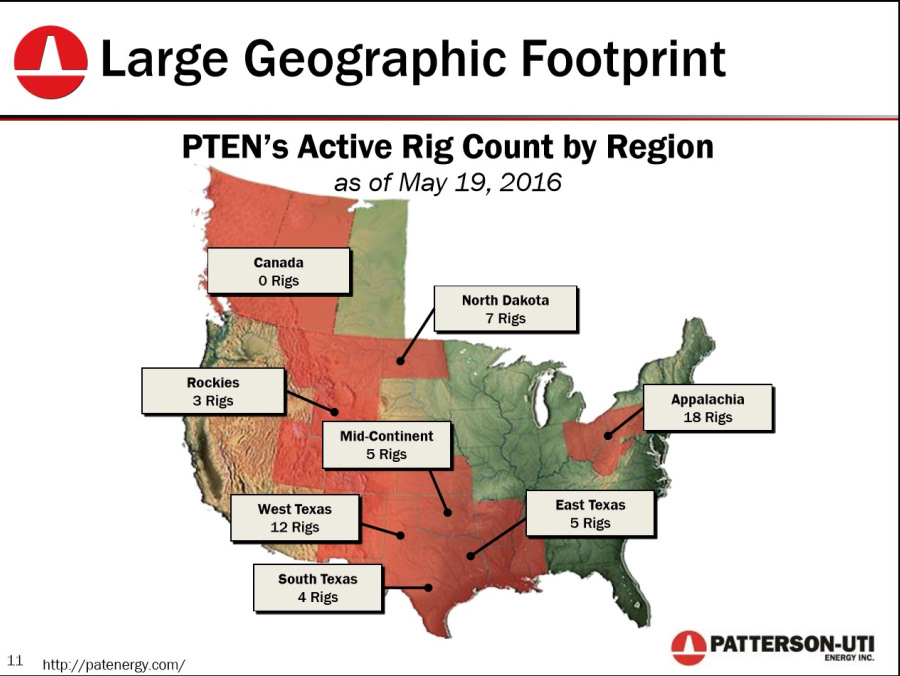
(Source: Patterson-UTI)
It sees the greatest demand in the Utica/Marcellus, followed by the Permian and Bakken. Almost all of its adjusted EBITDA is garnered from its 1500 hp AC driven rigs. All operators are seeing the same type of demand. The majority are high spec horizontal rigs with walking or skidding capabilities. Nabors (NBR) breaks this down even better.
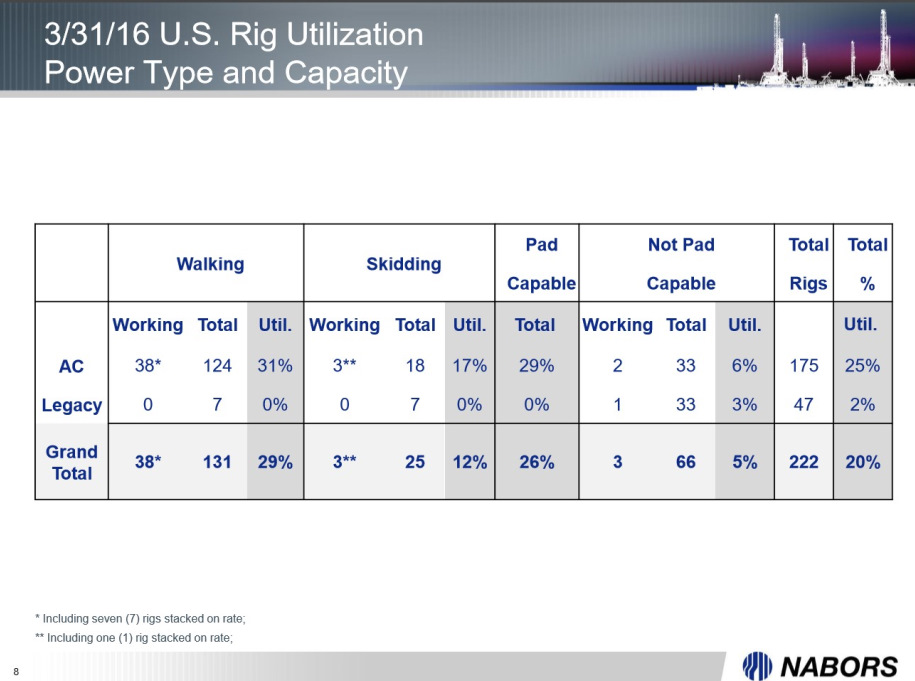
(Source: Nabors)
While utilization rates are very poor, it is much worse for legacy type rigs. Mechanical rigs are used in vertical drilling. Very few areas have the economics to support these types of wells. Of Nabor’s 47 legacy rigs, only one is currently used. AC driven rigs without the ability to be used for pad drilling have a utilization of just 6%. Walking (31%) and skidding (17%) are the bulk of demand for NBR’s rigs. Even when utilization is highest for its rigs with the best day rates, we continue to see those decrease as well. In 2Q15, NBR reported gross margins of $13,739 per rig per day. As of 1Q16, that number is $10,043.
The most recent BHI rig report noted an increase in rigs. Oil rigs were up 11 while we saw a decrease in gas rigs by 1. 7 horizontal rigs were added along with 8 vertical rigs. Directional rigs also decreased by 5. There are 332 horizontal rigs running and 38 directional. 61 vertical rigs are currently contracted. 4 rigs were added in Texas and Oklahoma, with another 2 in Colorado. Louisiana added one rig while New Mexico and Alaska lost one.
In summary, we may need to begin to look at the BHI weekly rig report in a different way. Although it lets us know which areas are adding and subtracting rigs, it does little to show how productive each rig is. Although rig numbers have dropped, production is decreasing relatively slowly. Many thought this would occur much more quickly than it has given the decline rates of US horizontal wells. Rigs are now drilling far more holes per month than just a couple of years ago, and this rate is still improving. HP seems to have held up the best when compared to the industry but all players are having problems and bankruptcies may need to occur for a balance to be achieved.
Data for the above article is provided by welldatabase.com. This article is limited to the dissemination of general information pertaining to its advisory services, together with access to additional ...
more


Always learn from reading you Michael. How does a zipper frac work??
I'm curious about this as well. First time I've heard the term.
Thanks for commenting Alexa and Michael. Great question, and one that I should have described better or in more detail in the article. A zipper frac is done on one well pad with several drilled but un-completed welds are located. The completion crew can complete those wells at (not exactly the same time) the same time. Once the crew gets started on the first it starts the second and the third, etc. it saves a significant amount of time which also saves a lot of money. The more wells done on one pad the more money saved
Fascinating, thanks for explaining.
Your welcome Dan, let me know if you ever have any questions.