
And Good News For Silver Investors Too
(Click on image to enlarge)
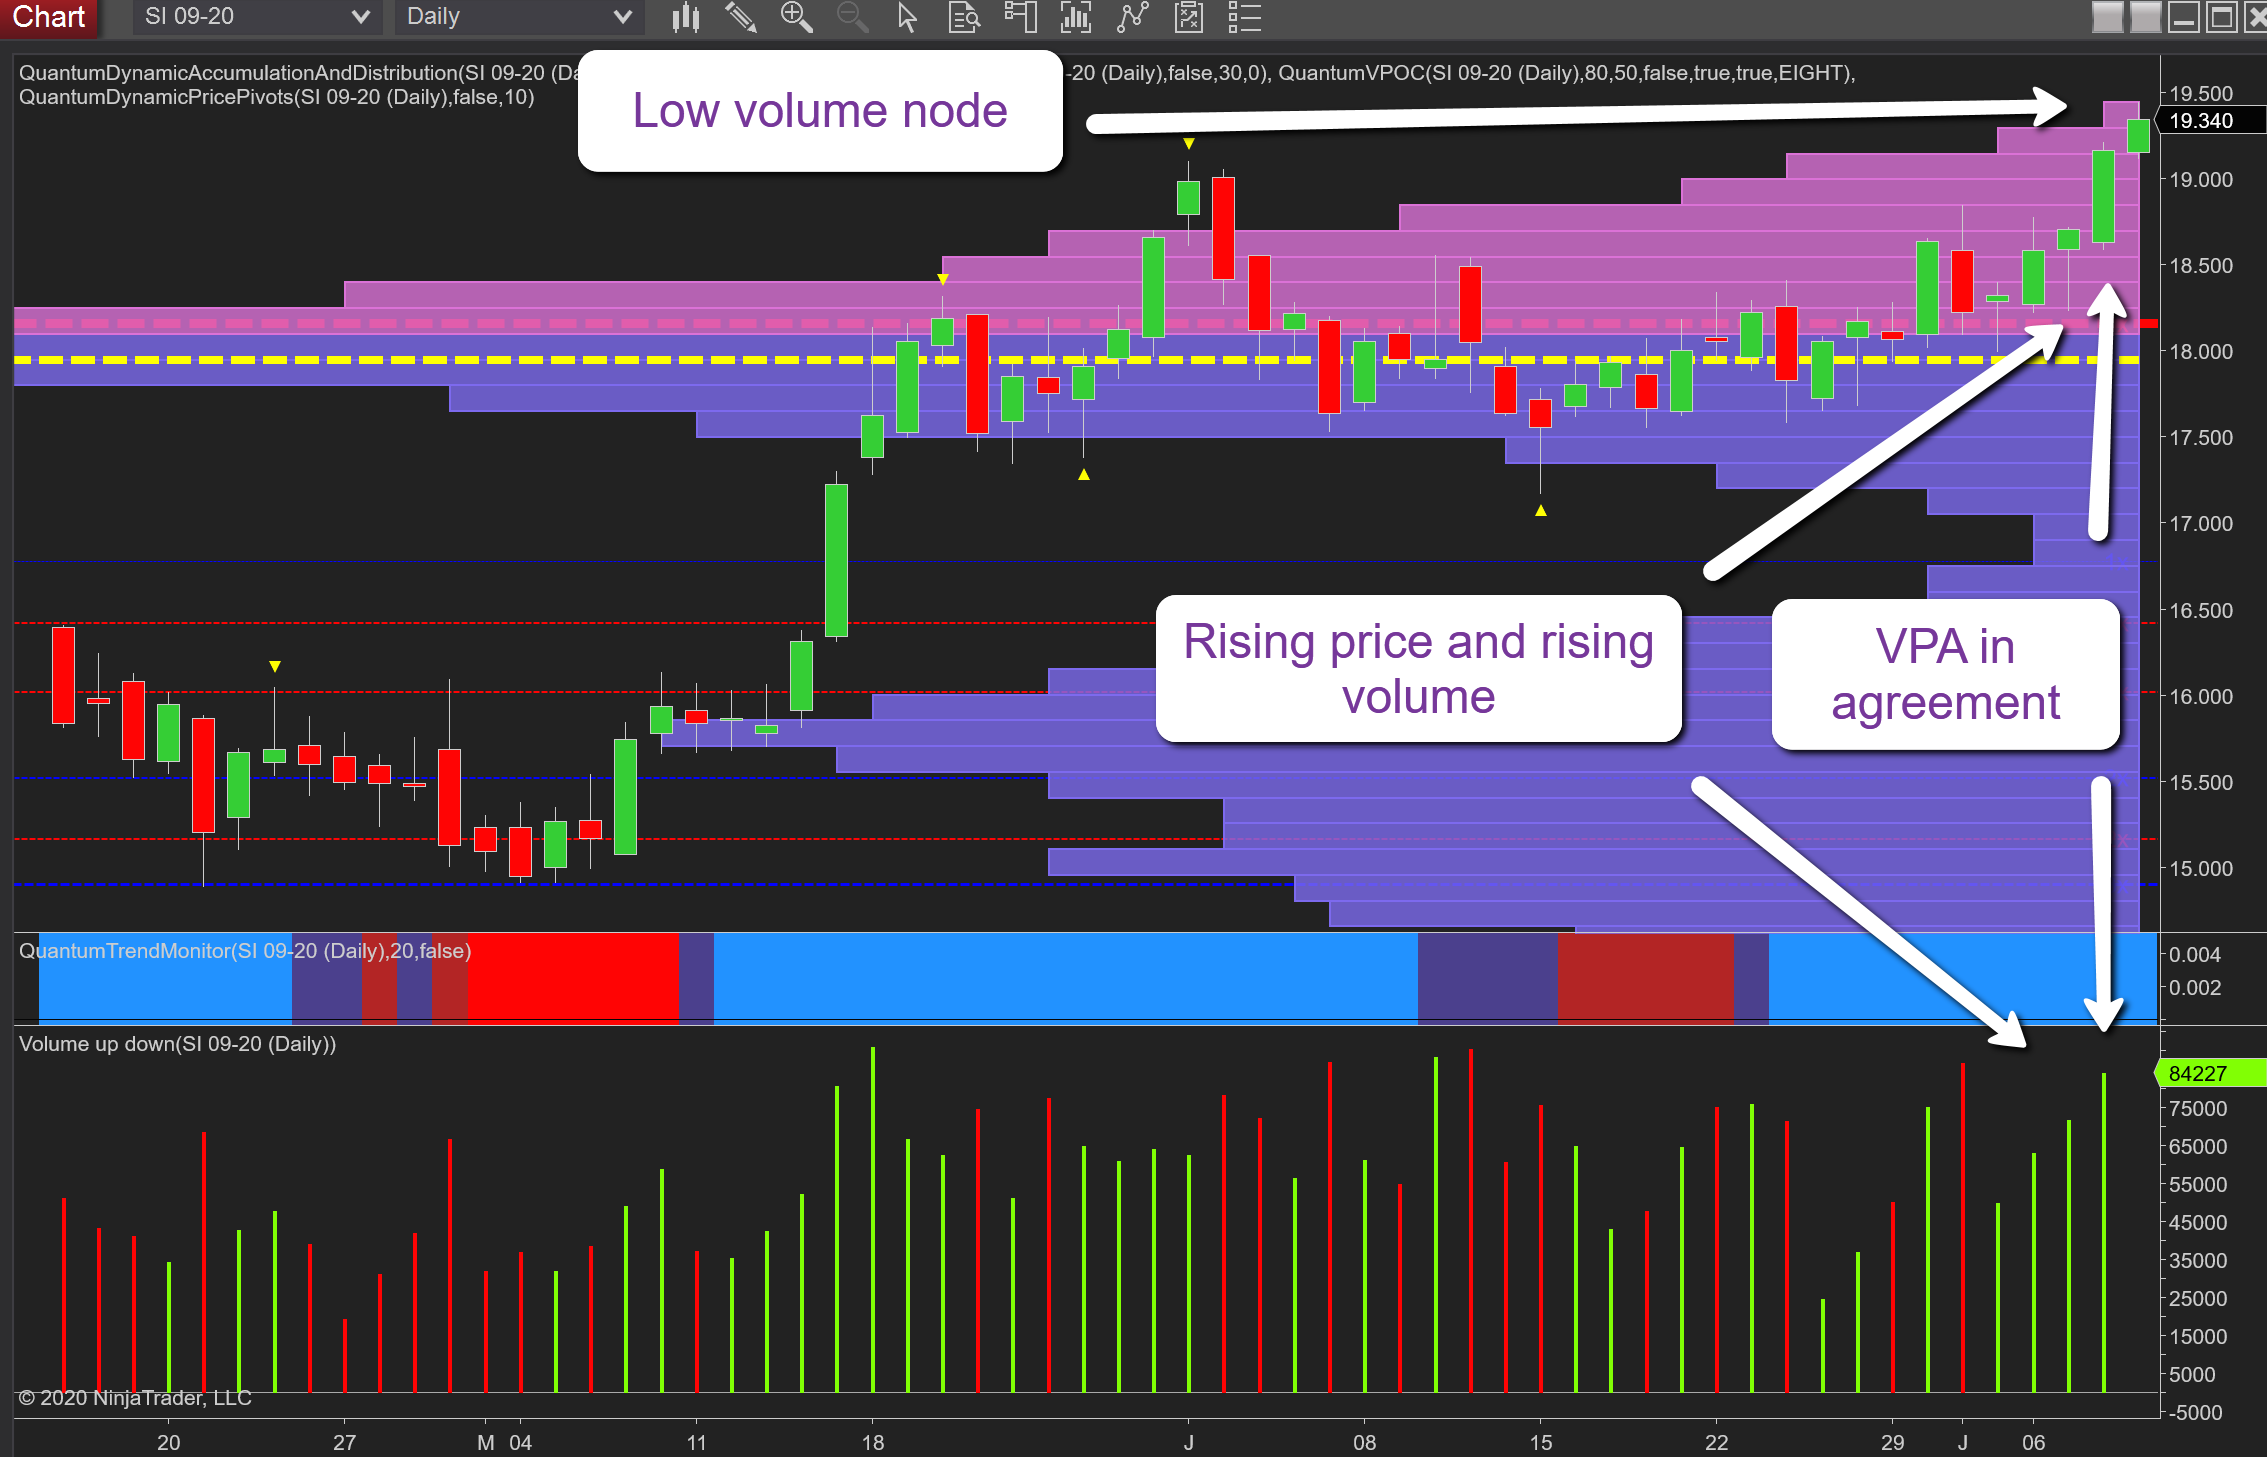
As for gold, so it is for silver and a wonderful example of all the elements of volume price analysis in action with the industrial metal now moving towards the $20 per ounce region which is one I have been highlighting for some time. Now with the pull-through effect of gold, it is a level that is likely to be breached sooner rather than later as we trade at $19.35 per ounce at the time of writing. So what are the lessons?
First, we have yesterday’s excellent move of a wide spread up candle on excellent volume with the two in agreement. Second, we have a rising price and rising volume and once again confirming Wyckoff’s laws confirming this is a genuine move. Third, we have a strong move away from a congestion period which has been in progress for some time. As a result here it is a case of Wyckoff’s second law of cause and effect – the longer the cause then the greater the effect and so we can expect to see a strong trend develop. Finally, as we can see on the chart, silver is now approaching a low volume node on the volume point of control histogram and as such we can expect to see the metal move through here with relative ease. So whether you are a gold or silver investor, it’s all good news for the longer term.
Meantime the levels to watch are as follows: $19.74, $20.35 & $20.77.
Disclaimer: Futures, stocks, and spot currency trading have large potential rewards, but also large potential risk. You must be aware of the risks and be willing to accept them in order to invest in ...
more

