
An Anomaly On The Daily Chart For Gold
A fascinating day of price action for gold on Friday, and whilst I was expecting gold to fall as I suggested last week, the speed and extent surprised even me. I had anticipated a return to the volume point of control at $1564 per ounce, but not on a single day!
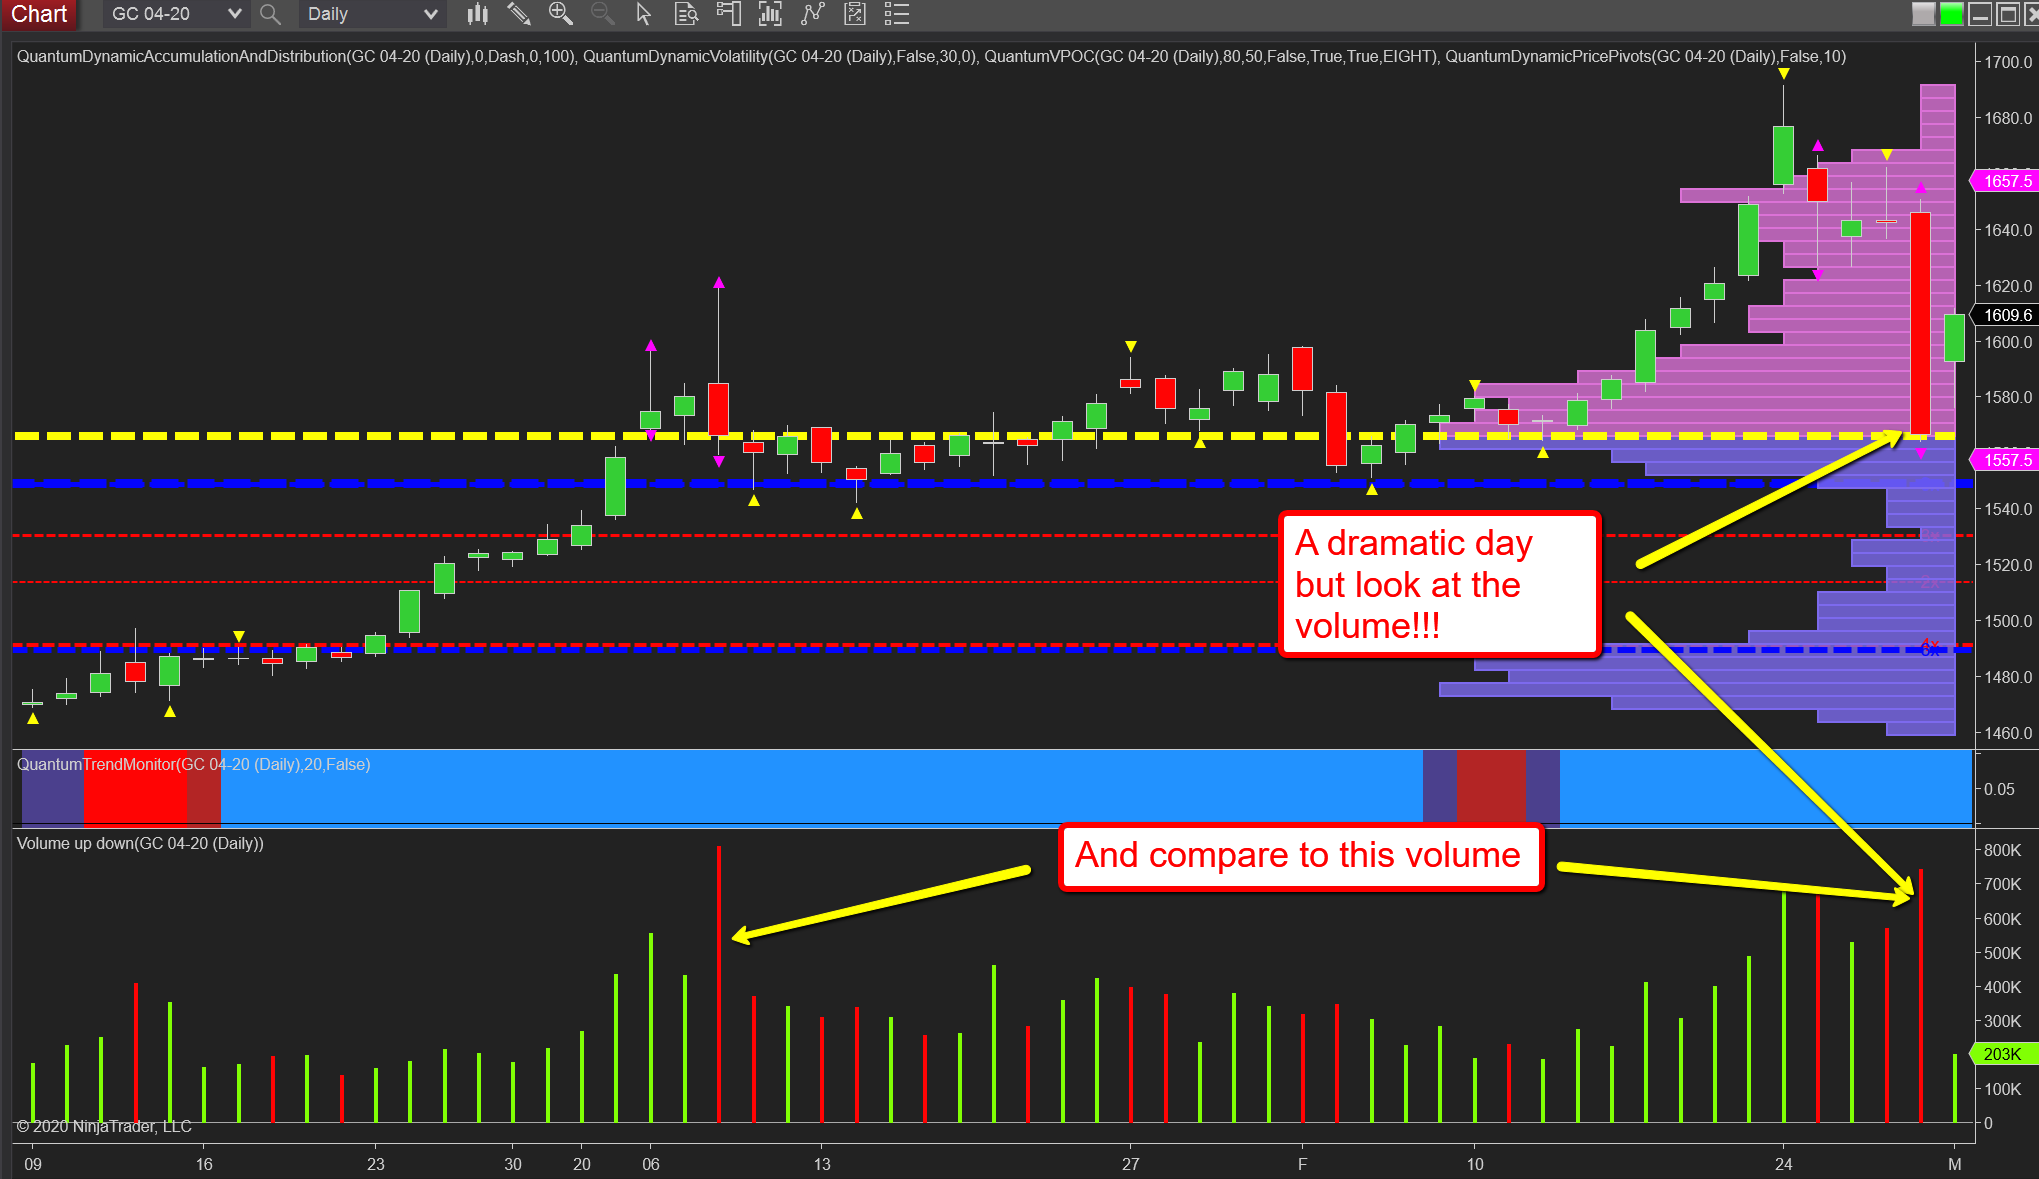
That said, two things are clear. First, the volatility indicator was triggered on the candle and so we can expect to see gold consolidate within the range of this candle over the next few days which is good news for gold bugs. Indeed in early trading the precious metal has opened gapped up and already regained the $1600 per ounce region and rising as I write. Second and perhaps more importantly, note the volume associated with this dramatic move. Is this in agreement with a move of $80 per ounce? I would suggest not, a fact confirmed when we consider this volume against volume earlier in the year, where we see it is, in fact, less than the move in January. So there is an anomaly and as such a trap being sprung as the big operators are not participating in the move lower, and hence we expect to see a rally developing which is already underway.
(Click on image to enlarge)
Disclaimer: Futures, stocks, and spot currency trading have large potential rewards, but also large potential risk. You must be aware of the risks and be willing to accept them in order to invest in ...
more

