
After 4 Up Weeks, Gold At Crucial Juncture – Pause Likely Before $1,920s Get Taken Out
Gold has rallied for four straight weeks – up more than 14 percent from early March. Last week, the metal just about tested crucial resistance at $1,920s. Conditions – daily in particular – are overbought, and a pause is the path of least resistance before gold bugs could go after that ceiling again.
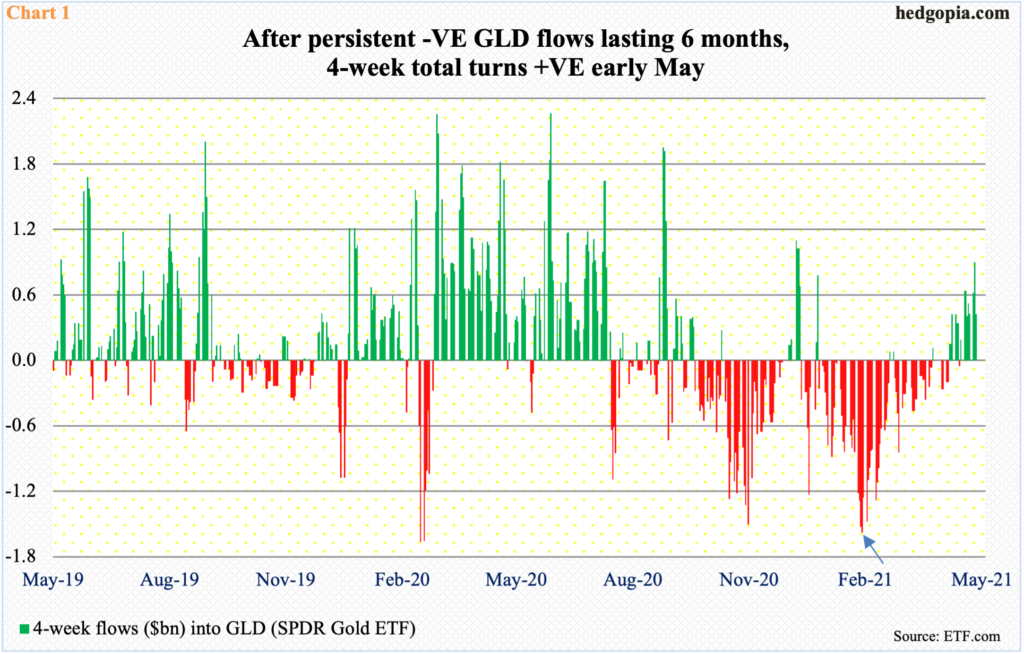
After a long dry spell, GLD (SPDR Gold ETF) is beginning to attract money. In the week to last Wednesday, $775 million came in, for a three-week haul of $1.5 billion. This follows persistent withdrawals of $8.7 billion in the prior 15 weeks.
Chart 1 uses a four-week total. The bars began to turn green in early May. Before that, it was a sea of red for six months. Incidentally, outflows bottomed in the week to February 25 (arrow), which was a week ahead of gold finding a low on March 8.
In the futures market, non-commercials too are warming up to the metal.
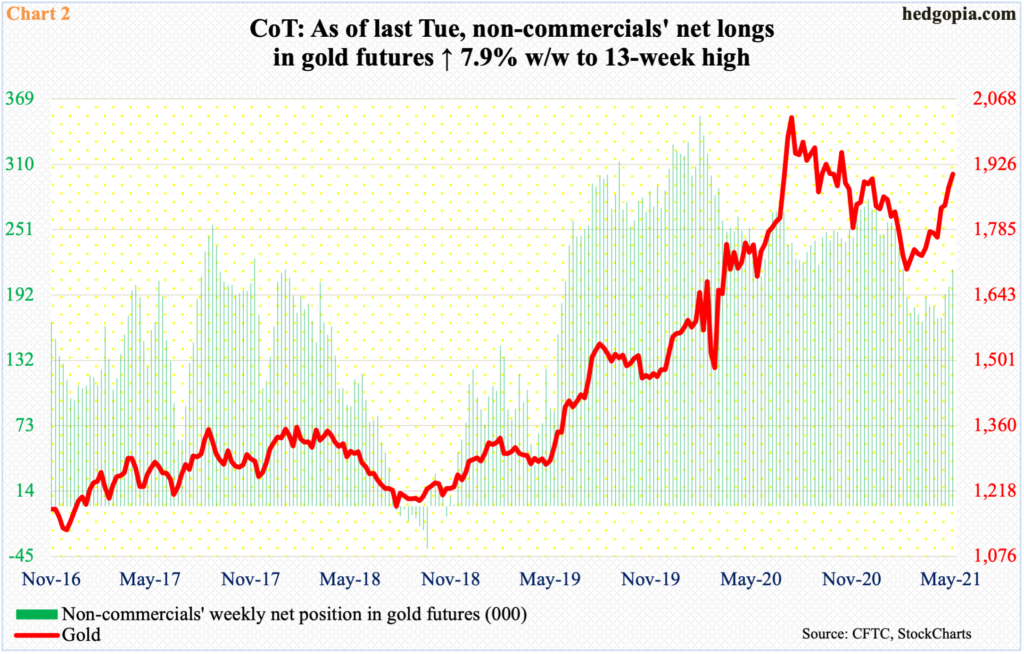
In early January, these traders were net long 279,318 contracts in gold futures, which they gradually began to trim. By late March, they had cut their holdings down to 167,528 contracts. But it was not until early May the green bars in Chart 2 bottomed in earnest – at 170,741 contracts. In the next three weeks, they added each week.
As of last Tuesday, non-commercials were net long 214,642 contracts – a 13-week high.
The turn in non-commercials’ sentiment jibes with the four-week low in GLD flows.
Sentiment improved as gold ($1,905.30/ounce) early this month decisively broke free of $1,760s-$1,770s.
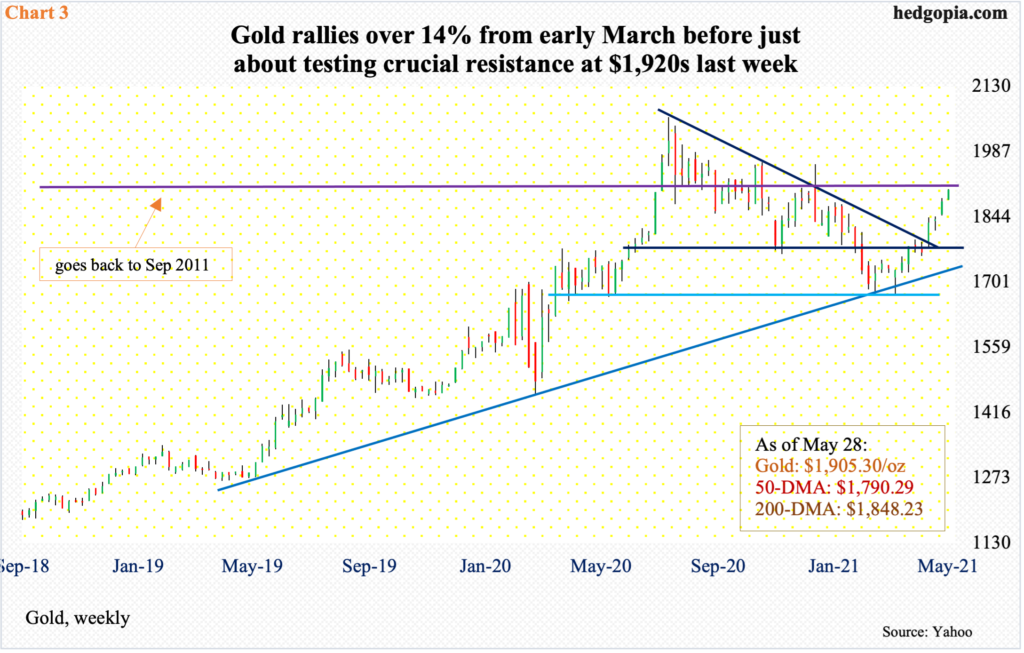
The yellow metal peaked last August at $2,089.20. The subsequent decline bottomed in early March when it ticked $1,673.30, which was again tested later that month. There is decent support at $1,670s and this was defended.
This was then followed by the reclaiming of the 50-day moving average in mid-April. Right around that time, gold retook $1,760s-$1,770s before going sideways until early May. Then, the metal broke free. This coincided with a breakout at a falling trend line from last August’s all-time high (Chart 3).
Gold has now enjoyed four consecutive up weeks and has approached a crucial juncture.
In September 2011, the metal retreated after tagging $1,923.70, which was a new high back then. In the subsequent bear market, gold would not bottom until December 2015 when it touched $1,045.40. That high has a lot of memory attached to it.
As a matter of fact, after last August’s high, bulls and bears locked horns around $1,920s quite a few times, particularly last year. This likely happens again before a breakout occurs.
Last Wednesday, gold ticked $1,915.60 intraday in a long-legged doji session. This was followed by a doji on Thursday and a hanging man on Friday. The daily is way extended, and the condition likely gets unwound in the sessions ahead.
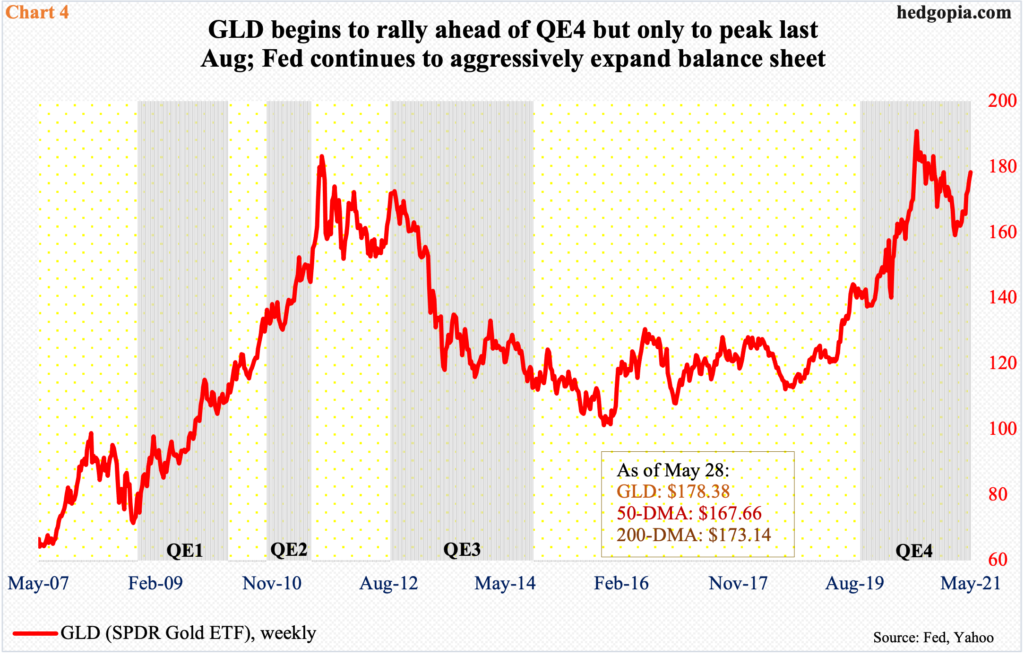
Incidentally, last August’s high, and the subsequent reversal, came amidst an aggressive expansion of the Federal Reserve balance sheet. In early March last year, the central bank held $4.2 trillion in assets; last week, this stood at $7.9 trillion.
Arguably, gold, or GLD, began to rally in anticipation of this buildup (Chart 4), but only to peak soon after even in the face of persistent printing by the Fed. A similar phenomenon unfolded leading up to the prior high from September 2011. By then, the Fed was already through two iterations of quantitative easing (QE). The metal peaked shortly after QE2 ended and made a lower high as QE3 began.
One would think the pace at which the Fed is accumulating assets would help gold. It has, but not to the extent gold bugs would like. As things stand, their first hurdle is to take out $1,920s, which in all probability is imminent but not before digesting the recent gains.
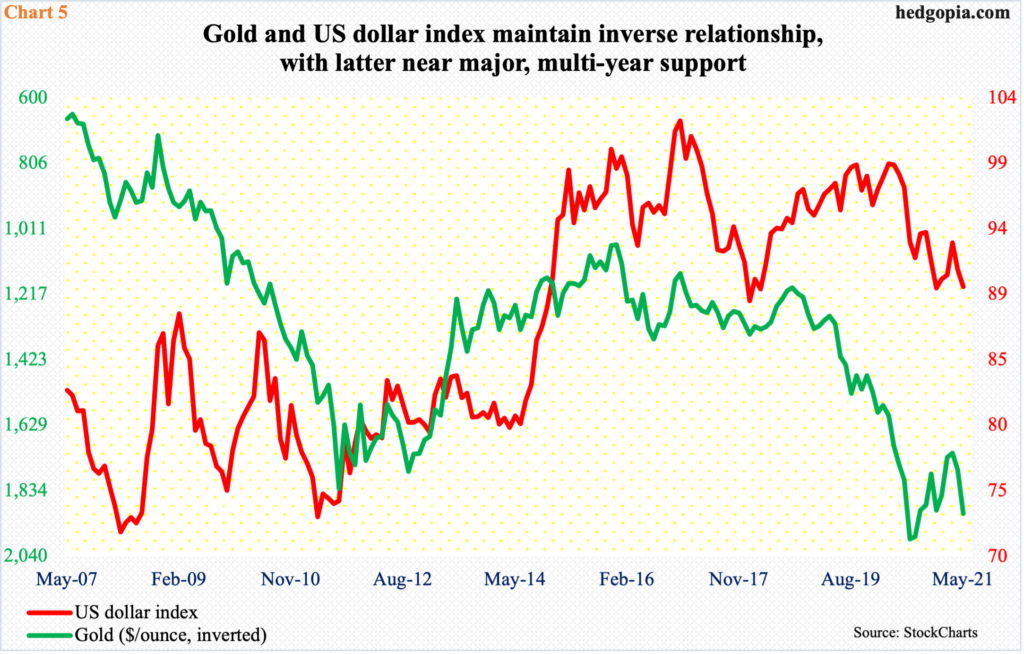
Right here and now, the wildcard is the US dollar, which tends to be inversely correlated with gold (Chart 5).
On January 6, the US dollar index dropped to 89.17 intraday before reversing higher; on that very day, gold reversed lower after ticking $1,962.50. Come March 31, the dollar index tagged 93.47 intraday and reversed lower; on that very day, gold successfully defended the low reached earlier that month and headed higher.
On Tuesday last week, the dollar index touched 89.52 intraday, which undercut the prior week’s low of 89.63 but not quite the January 6 low. Support at 88-89 goes back at least 17 years. It is not going to give way that easy.
For the week last week, the dollar index (89.99) formed a long-legged doji. On the daily, the MACD just completed a potentially bullish crossover. The weekly is getting oversold. The path of least resistance is up. Shorter-term averages are still pointing down, and they need to stabilize before a rally ensues. Immediately ahead, there is resistance at 90.30s.
In this scenario, gold likely goes on the defensive. But for gold bugs, this is not the end of the world. Structurally, gold’s chart looks constructive. There is support at $1,870s, followed by $1,850s. The 200-day lies at $1,848.


