
A Strategy For The Buy Low, Sell High Mantra
“Buy low, sell high!” Bada-bing, bada-boom, and the money rolls in. If only it were that simple, we’d all be rich fairly quickly. However, after looking past the myths, there are strategies that can help in determining a bottom or a top, and one of them is to look for reversals.
Gold and silver both reversed yesterday (Jan. 11), which might seem bullish at first sight, but it isn’t.
Reversals are the key moments in any market because they often mark tops and bottoms. And – of course – everyone wants to buy at the bottom and sell at the top. That’s much easier said than done though because tops form exactly at the moment when the urge to buy is at its peak, and the opposite is true for bottoms. So, in order to make money, one needs to decide on not following what they “feel” is going to happen, but what the objective tools that have proven effective in the past suggest. If enough of them suggest the same thing, the odds are that the market is going to do something – regardless of how one “feels” about the market at a given time.
Reversals are particularly interesting because they allow one to enter the market almost right at the bottom and exit right at the top. And they work over and over again. They’re easy to spot too – the price was going up for days and now it moved up and then back down. Easy as that… Or is it?
You already know the answer. No, it’s not that easy. It may look simple, especially at first glance, but it’s not easy, and the emotional factors are not the only obstacle in determining whether or not a reversal was really important.
The thing about reversals that’s hidden in plain sight is that they are not only about the price. The key thing to look for during these reversals is volume.
We should see a fierce battle between bulls and bears, leaving one side overpowered – in the case of bottoms, bulls should overpower bears. Low or average volume means that the battle was not fierce, or that there was very little fighting done on a given day. The implications would likely be nonexistent.
So, what happened yesterday in gold and silver with regard to volume?
(Click on image to enlarge)
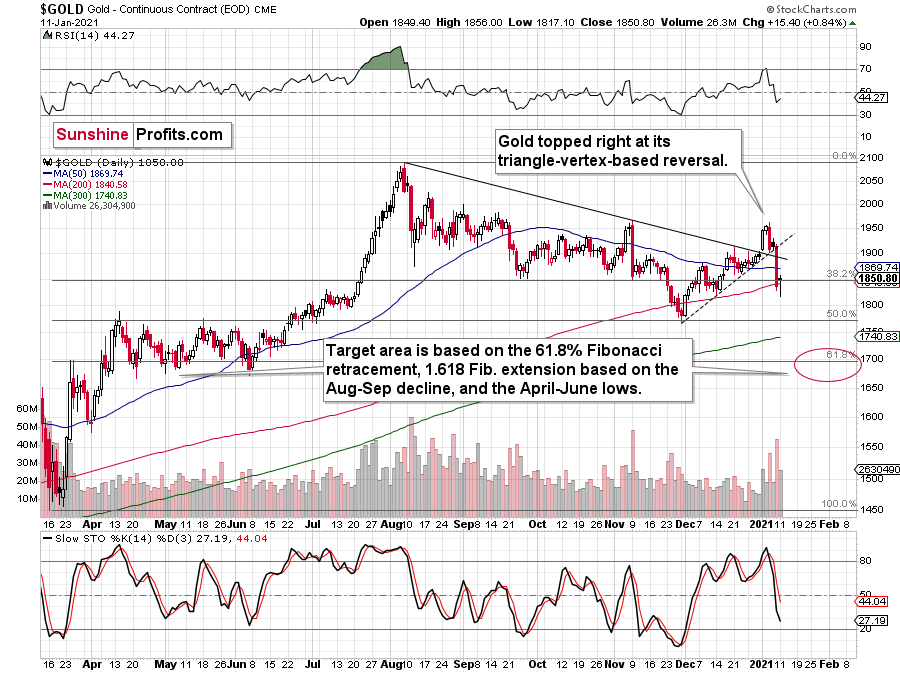
Figure 1 – COMEX Gold Futures
(Click on image to enlarge)
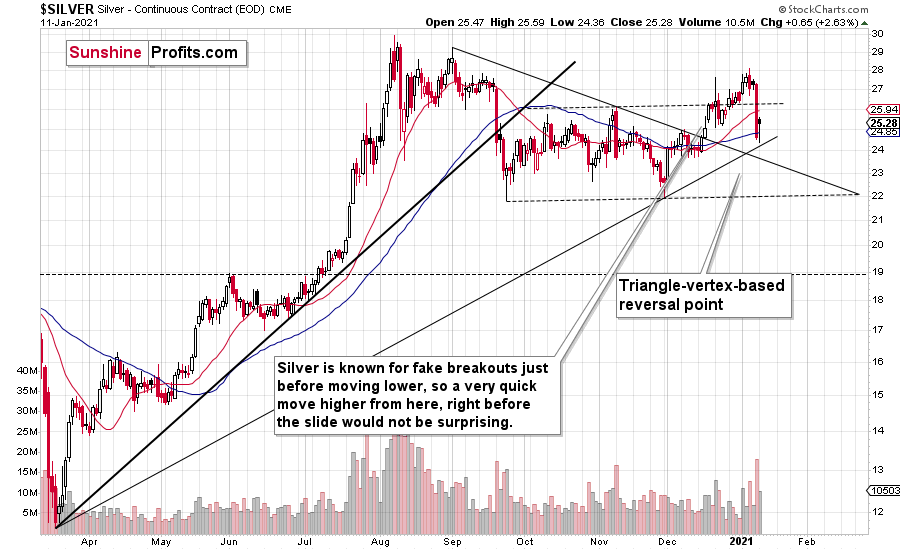
Figure 2 – COMEX Silver Futures
The volume was notable, but it was not huge. So, did gold form a critical reversal? Not really. It corrected some of its declines and took form of a reversal, but it didn’t have the reversal’s “spirit”. The bulls didn’t seem to have overpowered the bears. What seems to have happened instead, is that bears took a break after a massive daily victory.
You can see a good example of a clear reversal in silver, on Sep. 24, 2020. The volume was the second biggest in a month and slightly bigger than what accompanied the previous day’s decline. And indeed, that was a bottom for months.
Gold doesn’t feature any crystal-clear reversal example in recent history, but the closest to it would be the Aug. 12, 2020 session. Back then, gold reversed, but the rally was over in a week. So, did the reversal really work? It did, but only to some extent. And what kind of volume preceded it? It was big, but not huge. It was big enough to show a bull’s strength, but it was not truly groundbreaking. Thus, a limited reaction was perfectly justified – and that’s what we saw.
Getting back to the current situation on Monday, the volume was relatively average, so I don’t think one should focus on the “default, bullish” implications, because this is not a “default bullish” reversal. It’s a suspicious reversal that might have actually been a breather, so forecasting gold’s rally here would likely be a mistake. The volume doesn’t indicate that it was an important reversal – it’s only the price that indicates that.
So, will gold and silver plunge immediately? Perhaps, and perhaps not. Friday’s (Jan. 8) decline was quite profound, so a few extra days of back-and-forth movement or even a small rally, wouldn’t be surprising. The overall trend is down, and since the USD Index has already (most likely) bottomed, more downside should be expected for the precious metals.
Speaking of the USD Index, it’s breaking above increasingly more resistance lines.
(Click on image to enlarge)
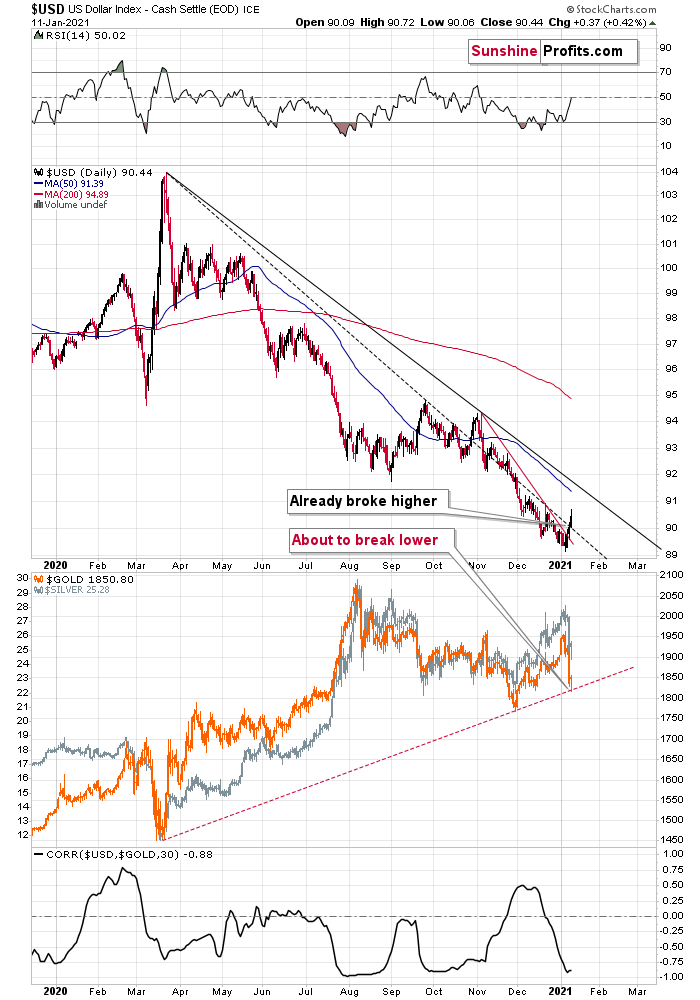
Figure 3 - USD Index, USD, GOLD and CORR Comparison
After confirming the breakout above the very short-term declining resistance line, the USD Index has now broken above the declining dashed line that’s based on the March 2020 and September 2020 tops.
With the correlation between the USD index and gold (bottom part of the chart) being strongly negative, the USD’s breakouts are bullish for gold. Namely, they tell us that after a breather, the USD Index is likely to continue its rally, while precious metals are likely to fall.
The next big move in the PMs is likely to take place once gold breaks below its rising support line, and that’s likely to happen relatively soon. Moreover, please note that the existence of the support line is – by itself – a reason for gold to correct before sliding. This makes the theory of yesterday’s (Jan. 11) reversal not being a true reversal even more valid.
All in all, it seems that the precious metals sector is about to decline once again, if not immediately, then shortly.
Disclaimer: All essays, research, and information found on the Website represent the analyses and opinions of Mr. Radomski and Sunshine Profits' associates only. As such, it may prove wrong ...
more

