
A Market Not For The Faint-Hearted
On Thursday of last week SPX was down 62 points. On Friday it was up 84. This market is not for the faint-hearted. Daily moves of 700 points or more are becoming common place for the DJIA. But you might as well get used to it because it shows no sign of abating, and more of the same is predicted for 2019. Great for traders who are on the right side of the trade. Volatility aside, the index is doing what it is supposed to do, which is rallying in the primary downtrend that started three months ago when SPX was at 2941.
Since the 2346 low of Dec. 26, what is construed to be a bear market rally has already tacked on 184 points and, after Friday’s performance, is likely not done yet. As I have mentioned before, the extent of counter-trend rallies or declines can be estimated using Point & Figure counts and Fibonacci ratios. The initial move after the recent low carried the index to a high of 2520 (which is what the P&F count had been estimated to be) before a three-day correction occurred, whereby a .382 retracement of the decline from 2800 was 2516. You can’t do much better than that.
On Friday, the index reached 2538 during its fourth hour of trading and consolidated between that high and 2522 during the rest of the session. Undoubtedly, the proximity of the February low of 2532.69 was deemed to be a good place to take profits after a daily move of 80 points. The question is whether the index spends some time consolidating in this area, or moves on right away. We’ll know Monday.
If the rally does extend before coming to an end, a 50% retracement would take prices to about 2575, and one of .618 to 2528. These levels, should they be reached over the short-term, would be a good place to anticipate an end to the rally and perhaps a resumption of the primary trend. However, while the bear market is expected to continue, when and exactly how much lower are still open questions.
Chart Analysis (The charts that are shown below are courtesy of QCharts)
SPX daily chart
Friday’s move took the index 18 points higher than the initial high of 2520, to the vicinity of the February low which created some resistance. But with prices holding up into the close with little retracement, we should assume that the move is not over and that it could carry up to the next resistance band which has been marked on the chart. In fact, at a .618 retracement to about 2625, it would reach the top of the resistance area as well as the bottom trend line of the original topping channel (pink). In addition, by the time we get there, the blue 50-dma will most likely have extended lower to that general level and will add increased resistance potential.
Whether we stop at the 2575 level or go on to 2625, there are P&F patterns already in place to support both of these projections, so either one is a possibility. If we did continue higher, it would mean one of two things: 1) we could be retracing the full distance from the 2941 top instead of that from 2800, or 2) we have already put an end to the correction and are in the process of extending the major trend from March 2009 -- although this option carries a very low probability factor. In any case, the resistance at the 2625 level will be formidable and, if/when we get there, some heavy selling should take place and we’ll have plenty of time to assess the market’s position and its next move.
As of now, the oscillators are all in an uptrend, and even though the CCI is not yet in the green, it would not take much more follow-through to put it there. If we make it to the 2575 target, the oscillator patterns should tell us if this is the end of the move or if we are likely to push ahead to the next one.

SPX hourly chart
The correction down from 2800 was contained in a channel which was broken on the downside in the last climactic move to the 2346 low. The rally took the index outside of its channel before consolidating after reaching a .382 retracement of the downtrend. During this consolidation, the top channel line served as support on three separate occasions with the last back test being on Thursday. Friday’s uptrend started with a large gap and continued until it had made a new high before some consolidation appeared.
As mentioned above, the February low -- as well as the pattern formation in the middle of the chart -- provided some resistance to a move which was over-extended after nearly 90 points without a correction. This could cause more of a near-term retracement than was already experienced during the second half of Friday’s trading session. In addition, while price overcame the former short-term high, the top oscillator (CCI) formed some negative divergence. This does not necessarily have to result in additional consolidation, but it does make it likely that more of a pull-back could take place before the rally continues.

DJIA, SPX, IWM, NDX (daily)
All four indices have started a new uptrend with IWM again leading the other three. It was not affected by the sharp drop in Apple on Thursday and held up better than the others, consequently out-performing them on Friday as well. The indicators are confirming the extension of the rally from the December low. All four indexes were stopped by the 13-dma initially, but on Friday they all made a new short-term high, closing well above it. Even if there should first be a little pullback, it looks as if we have registered a solid reversal with higher prices ahead.

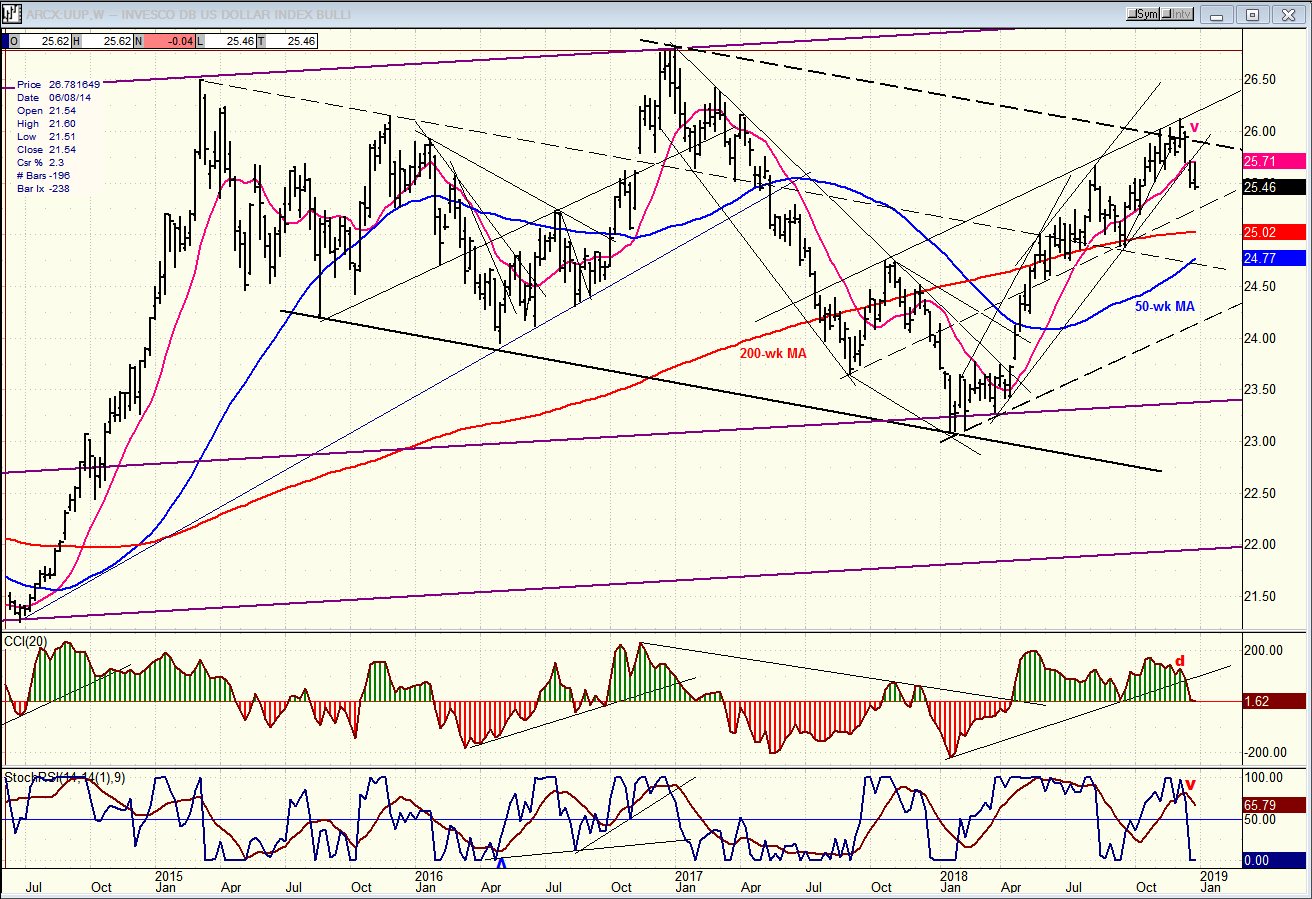
UUP (Dollar ETF)
The weekly chart of the index clearly shows that UUP has run into resistance and has begun to roll over. Besides breaking its uptrend line of one year, it has closed two consecutive weeks below its 13-wk MA -- both times on the low of the week. This suggests lower prices ahead with perhaps a brief hold at the mid-channel line (about 25.25) before pushing lower to the 200-wk MA which should provide better and longer support. The lower oscillator has already given a strong sell signal, and it’s just a matter of time before the upper one confirms by dropping into the red.
GDX (Gold miners ETF) weekly
Comparing the weekly charts of UUP and GDX shows that one can carry their reverse synchronicity just so far. GDX made its low before UUP made its high, and this results in a more bullish chart for GDX than UUP’s.This is also reflected in the oscillators, with both oscillators of GDX being more advanced. And the 50-wk and 200-wk MA of GDX are both on the verge of being overcome. All of this creates a bullish picture for GDX and, although it has some overhead resistance to overcome over the short-term, it should be able to move through it without too much difficulty since cycles are favorable until March.
During that time frame, the P&F chart suggests that GDX should be able to move to at least 25.50, and perhaps as high as 28.50.

BNO (United States Brent Oil Fund)
BNO has reversed and broken its downtrend line. After such a severe drop, there should be some base-building before it is able to get back in an uptrend, and 18.00 would seem to be the best it can muster over the short-term.

Summary
Since its reversal from 2346, SPX has been in a counter-trend rally which should move higher. Some potential projections were made for the short-term in the daily SPX analysis, above. It is not yet clear if a new low, or only a re-test of the low will follow after this bear market rally has been exhausted, with a new low coming only later on in the year.
Current Position of the Market
SPX: Long-term trend – Correcting within the very long-term bull market trend.
Intermediate trend – A bearish correction has started which could retrace as low as 2200 before it is complete.
Analysis of the short-term trend is done on a daily basis with the help of hourly charts. It is an important adjunct to the analysis of daily and weekly charts which discusses the course of ...
more

