
A Final Thrust Is Likely
In the last letter, I discussed the evidence building up warning that we were getting close to an intermediate top. I had also mentioned that there appeared to be some correlation between GDX making a 52-wk low and top in SPX. Ideally, the 52-wk cycle of GDX was supposed to bottom next week, but it looks as if it has already occurred. If that relationship continues, SPX should be just about there, and what better time to reverse than next week, when Congress passes the tax bill (now that the entrenched hold-outs have relented), with traders selling on the news. Of course, if it does not pass, the effect on the market is predictable.
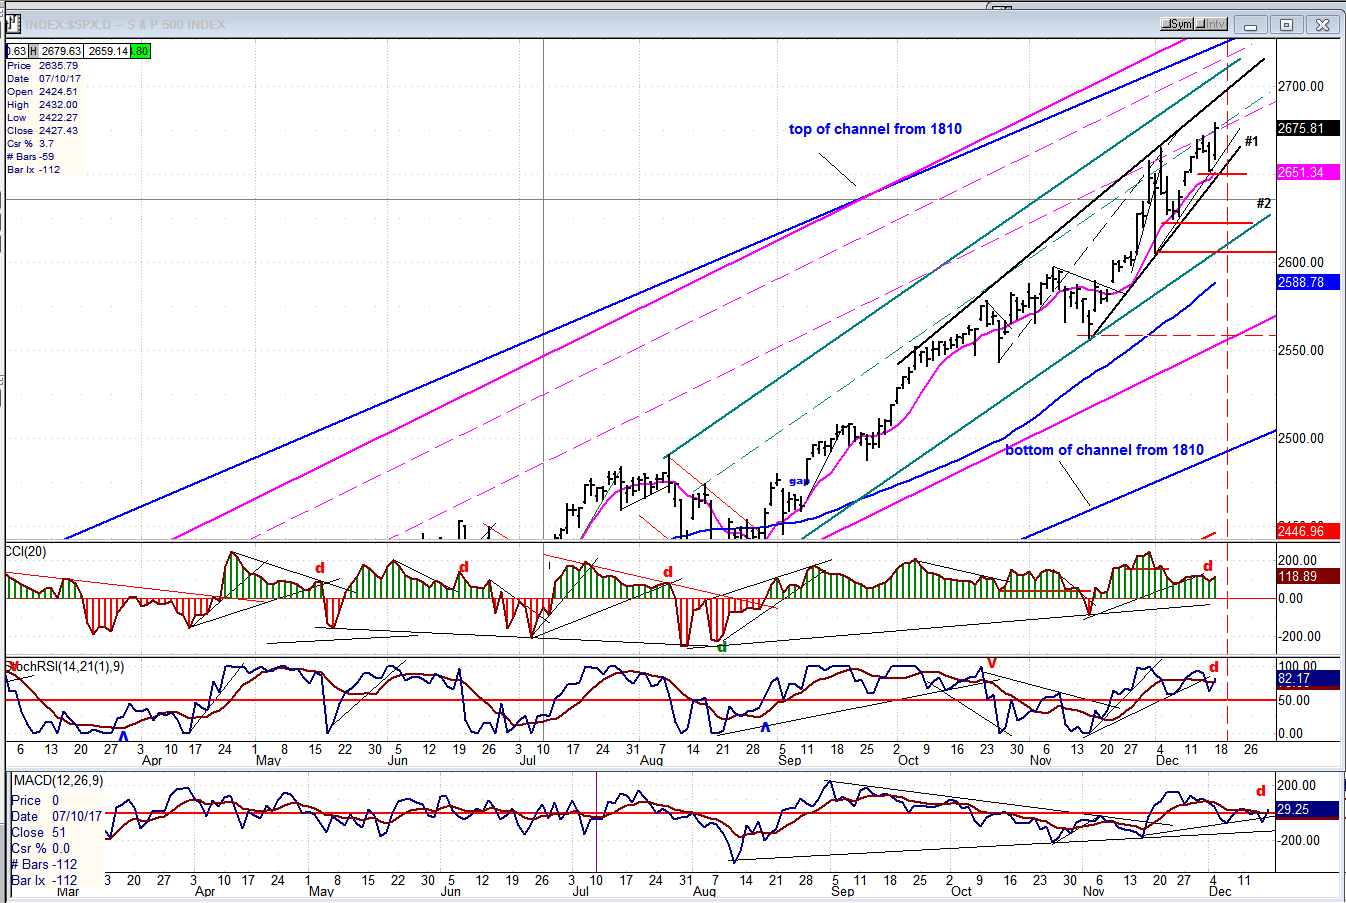
The last accumulation pattern of the SPX occurred at the 2635 level and created a potential count to about 2690+ maximum, and we could find some confirmation of that projection in the pattern just formed last week. So, let’s see what happens over the next few days.
Chart Analysis (These charts and subsequent ones courtesy of QCharts)
SPX daily chart:
You may notice that the market strength has forced me to redraw some of the larger channels in a more conventional way. Prices are no longer squeezed against the channel tops, but could still move higher before touching them. The top (black )channel is also best drawn as a wedge pattern which suggests that the final wave is most likely and ending diagonal triangle, which is a terminal pattern.
We discussed several other conditions besides channel resistance and projections which are associated with market tops. These include EWT wave completion (as an EDT), cycles bottoming directly ahead, and negative divergence at the weekly and daily indicator levels. If you look at the oscillators at the bottom of the chart, you will see that negative divergence is very plain, and this tells us that in spite of the apparent price strength, there has been a significant loss of momentum over the past couple of weeks. In fact, the volume pattern also suggests that distribution is most likely taking place. Notable was the DJIA’s huge spike in volume on Friday, as it barely cleared the former high.
All the above warning signs suggest that the index is probably reaching a turning point. Even if each factor mentioned represents one probability, adding them up only gives us a higher probability but not a certainty. In the last letter, we touched upon what would create the certainty of a price reversal of some magnitude. It would involve the breaking of important trend lines and breaching important support levels in order to create a sequence of lower highs and lower lows.
That would start with breaking the black trend line( #1) and moving below the top support level (horizontal red trend line). In order for this to be an important decline, we would also have to break trend line #2, and breaching the next two (red) support levels. Should we continue to decline until we reach 2557 and the starting point of the EDT, it would represent a correction of over one hundred points. This may be enough for this phase of the decline, although we will know better when the entire top has been completed and the reversal has occurred. Then, we can make a fairly accurate estimate of the correction’s extent.
SPX hourly chart:
The same black wedge pattern and green channel are expanded on the 6m chart. As you can see, the index could easily meet the top projection without really violating any of the top channel lines. It’s also interesting to observe that since the 2557 level, the blue 55-hr MA has acted as support for prices, while the 233-hr MA has pretty much followed the bottom line of the green channel. We can therefore assume that a break below both of these trend lines and MAs would bring about an important correction.
The hourly oscillators are also showing some divergence which may not hold up if we go all the way to the higher target, but we do not have to achieve those maximum levels and could reverse from a lower one. There are several interim phase projections which could turn out to be the final high.

An overview of some important indexes (daily charts)
There has not been much change from last week in these indexes, but what did occur could be significant. The semiconductors, represented by SMH (top right) remains relatively weak. More importantly, IWM (bottom left) is now clearly diverging from the overall market. This is important since it is one of the most reliable leading indexes. TRAN (second from left, bottom) is also beginning to do the same, which is also important. Too early to draw a definite conclusion, but definitely a warning.

UUP (dollar ETF)
UUP is still neutral short-term, halting its advance on the trend line last week but not being repelled by it. More time is required to assess its intention.

GDX (Gold miners ETF)
GDX may have reached its intermediate low a week ahead of the ideal time frame. Next week will decide if it is ready to resume its uptrend or needs a little more consolidation. If it does start to move higher, it will run into some resistance around 23.00. For a longer-term advance, it will be challenged by several trend lines of various degrees, and we’ll have to see how it handles them. For a decisive intermediate term break-out, it will have to move above the 25.50 tops. If it can clear them, it can advance to 35-40.00, or more if it adds an additional count to the accumulation phase.

USO (United States Oil Fund)
USO is observing the anticipated resistance with a sideways consolidation. Since the bias is still for higher prices, it’s probably only a matter of time before it clears it. The resistance is mostly in the first layer, and the second may not produce much of a challenge. After moving above it, it could advance to about 15.00 before its next consolidation process begins.

Summary
Nothing has occurred during the past week to alter my view that a top is in the making with a subsequent initial decline into mid-January or later.
Current Position of the Market
SPX: Long-term trend – The bull market is continuing with no sign of a major top in sight.
Intermediate trend –Final top next week?
Analysis of the short-term trend is done on a daily basis with the help of hourly charts. It is an important adjunct to the analysis of daily and weekly charts which discusses the course of ...
more

