1600 Gold?
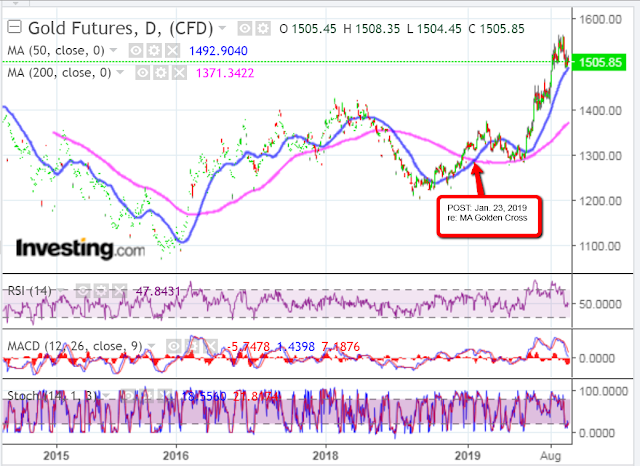
How about that... since I wrote my post of January 23, GOLD Futures (GC) finally hit just above its target price of 1550 on August 26...and it carried on to make a 2019 high of 1566.20 on September 4, for a gain of 21.58% from that date.
The moving average Golden Cross, that had just formed a couple of days prior to that, held, price retested the 200 MA (which is normal after these form), and the formation is still in play, as shown on the following daily chart of GC.
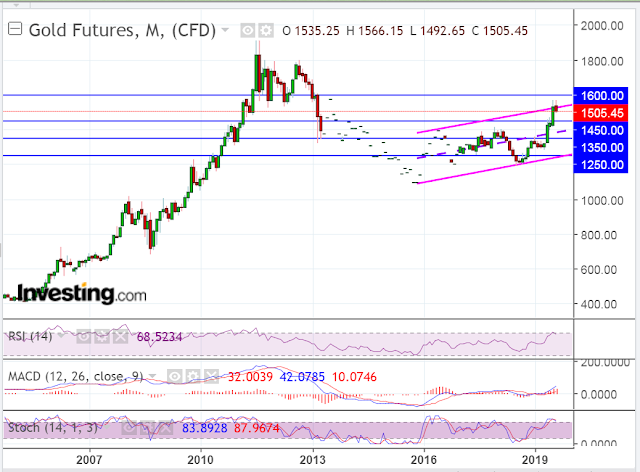
The following two monthly charts show that major resistance lies at 1600, while near-term support sits at 1450.
Although price looks overextended according to the RSI, MACD and STOCHS indicators, and it has run up against the top of its long-term rising channel, we may see momentum drive price higher, depending on what happens with the fallout from the Saudi Arabia oil refinery attack this past weekend, about which I've written here.
In the short term, keep an eye on the daily RSI, MACD and STOCHS for clues on price direction and strength. They're mixed at the moment, but, if the RSI breaks and holds back above 50.00 and if we see upside crossovers of the MACD and STOCHS that hold, then we should see higher prices. At the moment, GC is sitting just above the 50 MA, which is providing near-term minor support.
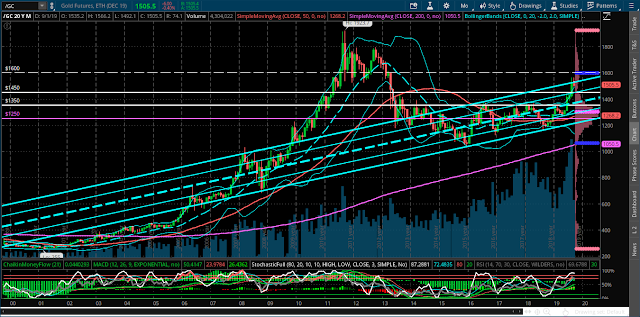
1600 happens to be the Upper Value level of the Volume Profile shown along the right-hand side of the last chart. An escalation of Middle East military action could easily propel GOLD to that level, or much higher.