
Commitment Of Traders, What Hedge Funds, Noncommercials Are Buying
Following futures positions of non-commercials are as of October 5, 2021.
10-year note: Currently net long 141.3k, down 39.9k.
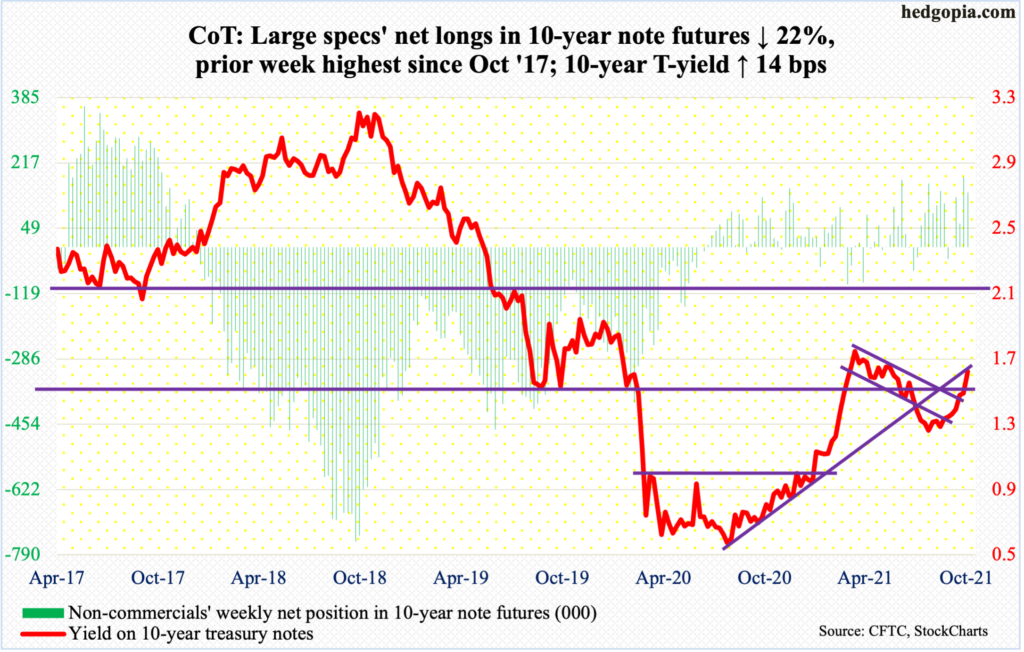
Minutes for the September 21-22 FOMC meeting are due out next Wednesday. During the meeting, Chair Jerome Powell set the stage for a tapering announcement in November. Currently, the Fed buys up to $120 billion a month in treasury notes and bonds ($80 billion) and in mortgage-backed securities ($40 billion). It intends to end the program around the second half of next year. The balance sheet has doubled from $4.24 trillion in early March last year to $8.46 trillion. There were also hints that rates may rise sooner than expected. The 18-person FOMC was evenly split on the prospects for a rate hike next year.
With this in the background, the minutes may not have a whole lot of new information as far as traders are concerned. The 10-year treasury yield has already made a move.
On the final day of the meeting on the 22nd, rates closed at 1.34 percent. Come September 24, the 10-year pushed through horizontal resistance at mid-1.40s, before ticking 1.62 percent intraday this Friday. The latest peak of 1.77 percent was posted on March 30.
Amidst the ongoing taper talk, it is important to consider how the 10-year traded during past iterations of quantitative easing. During the prior three, rates dropped in the weeks leading up to QE, bottoming around the time the Fed began purchasing these securities. Rates also tended to peak toward the middle of the program. It is possible the 10-year made an important high of 1.77 percent in March (more on this here).
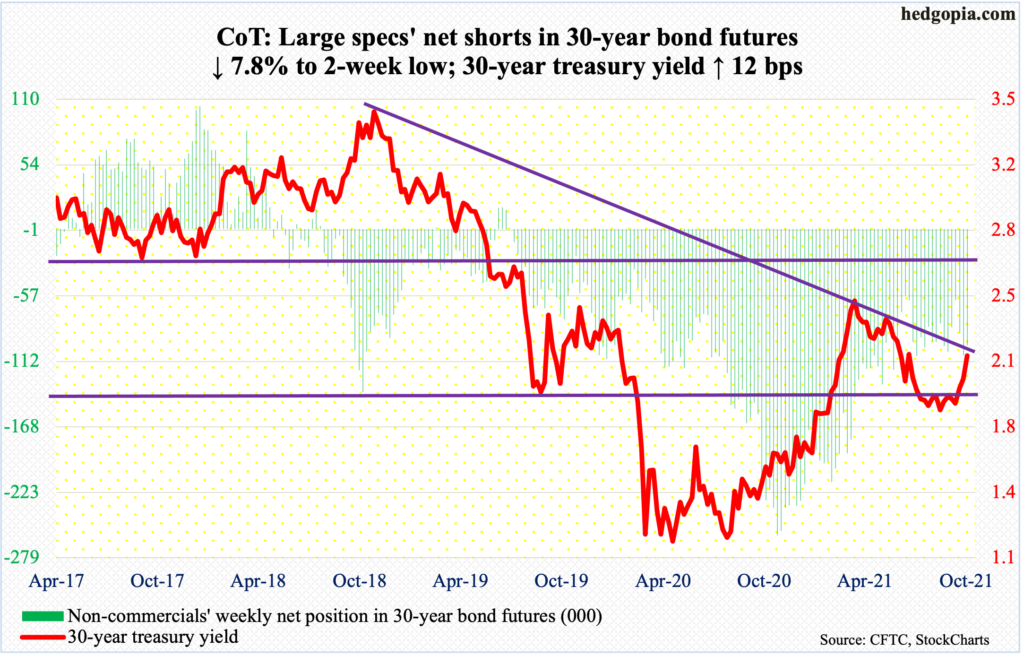
30-year bond: Currently net short 98.6k, down 8.3k.
Major economic releases for next week are as follows.
The NFIB Optimism Index (September) and job openings (JOLTs, August) are due out on Tuesday.
Small-business job openings edged up a point month-over-month in August to 50. The post-pandemic low of 23 was reached in May last year.
In July, non-farm job openings jumped 749,000 m/m to 10.9 million – a new record. For reference, there were 8.4 million unemployed people in August, which further dropped to 7.7 million in September.
The consumer price index (September) is scheduled for Wednesday. In the 12 months to August, core CPI grew four percent, which is elevated but was slower than June’s 4.5 percent. As recently as February, this measure of inflation grew at a 1.3 percent rate.
Thursday brings the producer price index (September). In August, producer prices grew 0.7 percent m/m and 8.3 percent on a year-over-year basis. Core PPI over the same time period increased 0.3 percent m/m and 6.3 percent y/y.
Retail sales (September) and the University of Michigan’s consumer sentiment index (October, preliminary) will be published on Friday.
August retail sales inched up 0.7 percent m/m to a seasonally adjusted annual rate of $618.7 billion. The all-time high of $628.8 billion was hit in April.
Consumer sentiment in September increased 2.5 points m/m to 72.8. August’s 70.3 was lower than the post-pandemic low of 71.8 from April last year.
WTI crude oil: Currently net long 396.3k, down 589.
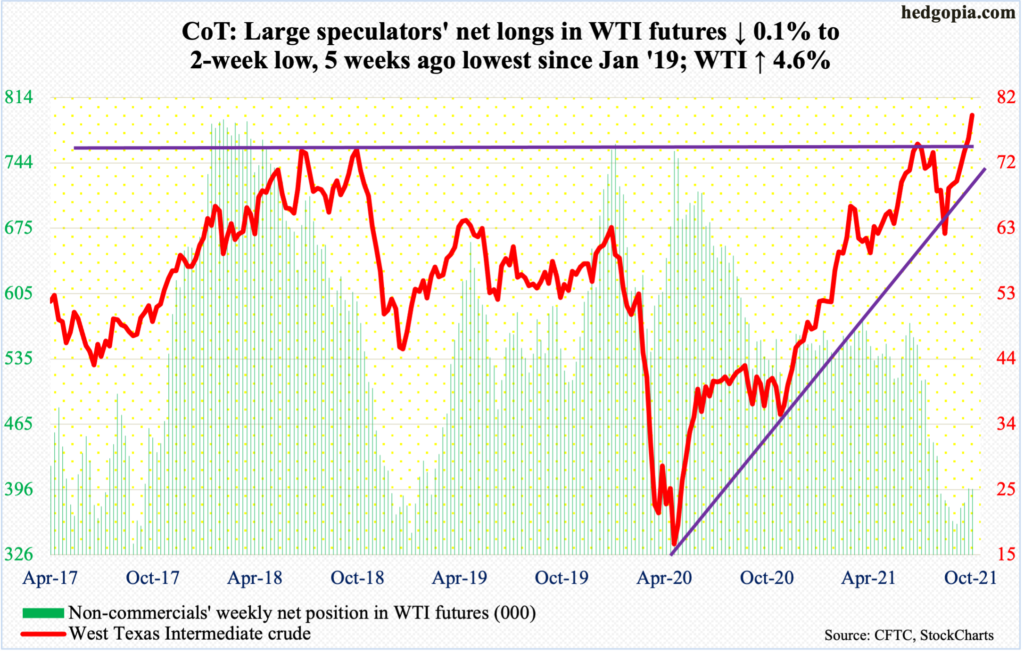
Oil bulls are doing a great job of riding the upward momentum. This week, they took out the July 6 high of $76.98. Earlier in October 2018, WTI retreated after ticking $76.90. On Friday, the crude ($79.35/barrel) rose as high as $80.11. This was preceded by Thursday’s drop to $74.96, which was bought. There is decent support at $74-$75. If the breakout is genuine, this level should continue to generate buying interest.
In the meantime, US crude production in the week to October 1 increased 200,000 barrels per day to 11.3 million b/d. Crude imports rose 483,000 b/d to seven mb/d. Stocks of crude and gasoline grew as well – respectively up 2.3 million barrels and 3.3 million barrels to 420.9 million barrels and 225.1 million barrels. Distillate stocks, however, dropped 396,000 barrels to 129.3 million barrels. Refinery utilization rose 1.5 percentage points to 89.6 percent.
E-mini S&P 500: Currently net long 72.8k, down 373.
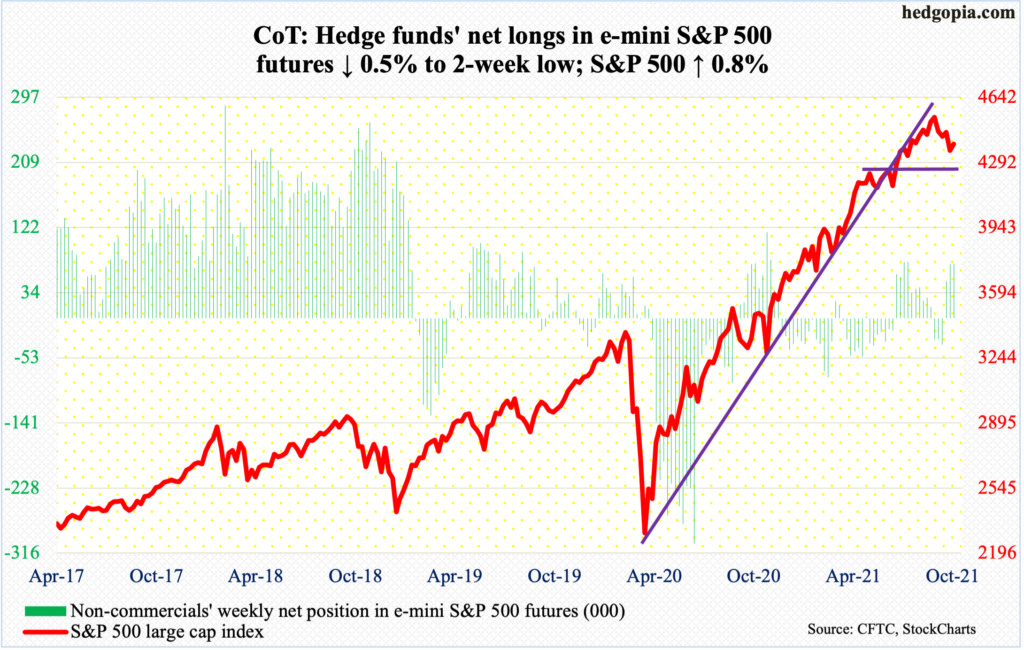
A lower low of 4279 was posted on Monday but only to then start drawing bids (more on this here). By Thursday, the S&P 500 rallied as high as 4430, although bulls were unable to hang on to all of the gains, resulting in a daily shooting star. Thursday’s high came close to testing the 50-day (4438); plus, bulls had an opportunity to break out of a falling trend line from September 2 but could not quite deliver.
Despite having dropped earlier to an 11-week low, the S&P 500 (4391) rallied 0.8 percent this week. Flows improved. In the week to Wednesday, US-based equity funds gained $4.9 billion (courtesy of Lipper). In the same week, SPY (SPDR S&P 500 ETF), VOO (Vanguard S&P 500 ETF) and IVV (iShares Core S&P 500 ETF) lost $1.8 billion (courtesy of ETF.com). In the prior couple of weeks, they respectively lost $16 billion and $4.9 billion, in that order.
On the daily, there is room to rally further. If the 50-day falls, there is horizontal resistance at 4480s. Alternatively, bears can get active here. The 50-day already repelled a rally attempt on Thursday. To boot, daily indicators such as the RSI seem to want to go lower from the median.
Euro: Currently net short 22.3k, down 23.2k.
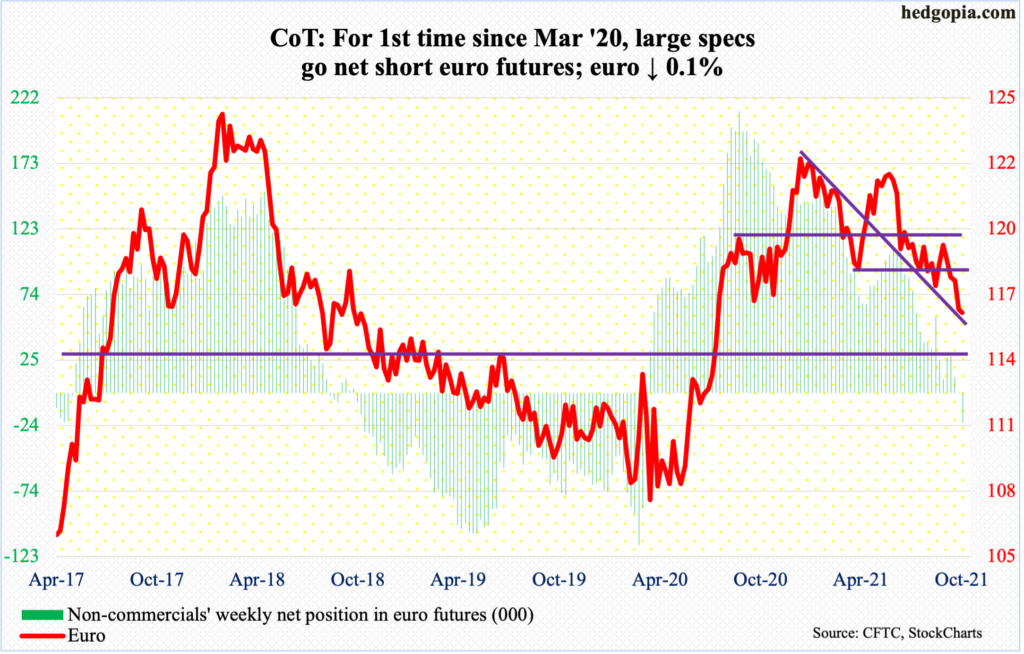
The euro ($1.1572) is in the process of testing crucial support. Horizontal support just south of $1.15 goes back 18 years. On Wednesday, the currency tagged $1.1533. Shorter-term averages are still sharply falling, and they need to stabilize. Amidst this are appearing signs of fatigue. In the last seven sessions, three doji’s formed.
Besides the aforementioned support, Wednesday’s low also kissed a declining trend line from August last year. This offers another opportunity for the bulls to try to step in around here. In the event things evolve this way and the euro rallies, selling pressure can intensify at broken-support-turned resistance of $1.17-plus.
The prevailing bearish mood is captured by non-commercials who are now net short – the first such occurrence since March last year. At some point, sentiment will get too negative to sustain.
Gold: Currently net long 182.6k, up 14.2k.

One more week of negative flows and one more week of sideways action. In the week to Wednesday, IAU (iShares Gold Trust) and GLD (SPDR Gold Shares) respectively lost $135 million and $196 million (courtesy of ETF.com). For the week, gold ($1,757/ounce) shed 0.1 percent. It has essentially gone sideways the last four weeks.
The metal is back below both the 50- and 200-day (respectively $1,781 and $1,801). In all five sessions this week, it unsuccessfully tried to reclaim $1,760s-$1,770s. Friday, in fact, gold rose as high as $1,781 but only to reverse sharply lower to finish with a gravestone doji.
Meanwhile, the daily RSI is struggling to push through the median.
In essence, the metal remains sandwiched between $1,760s-$1,770s and $1,670s. The latter was defended two months ago, even as the former was reclaimed early September, but gold bugs were unable to keep up the momentum.
Nasdaq 100 index (mini): Currently net short 2.7k, up 373.
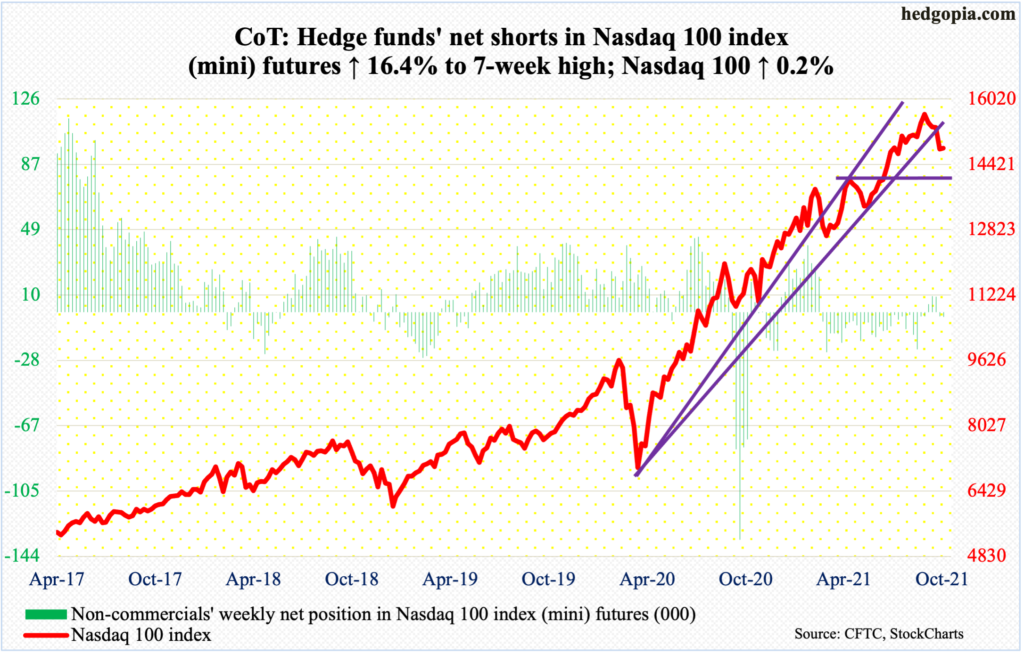
The Nasdaq 100 (14821) eked out a 0.2-percent gain this week – first up week in five.
After September’s outside month, tech bulls are trying hard to put their foot down, but progress has been coming in haltingly.
The week started out with Monday’s lower low of 14385, which represented a decline of 8.3 percent from the September 7 high of 15701. The rally in the subsequent sessions stopped at 15000 on Thursday when a gravestone doji formed with sellers showing up in droves at gap-down resistance from September 28. If this roadblock gives way in the sessions ahead, then there is another layer of resistance at 15100-15200, with the 50-day at 15176.
Russell 2000 mini-index: Currently net short 58.6k, up 3k.
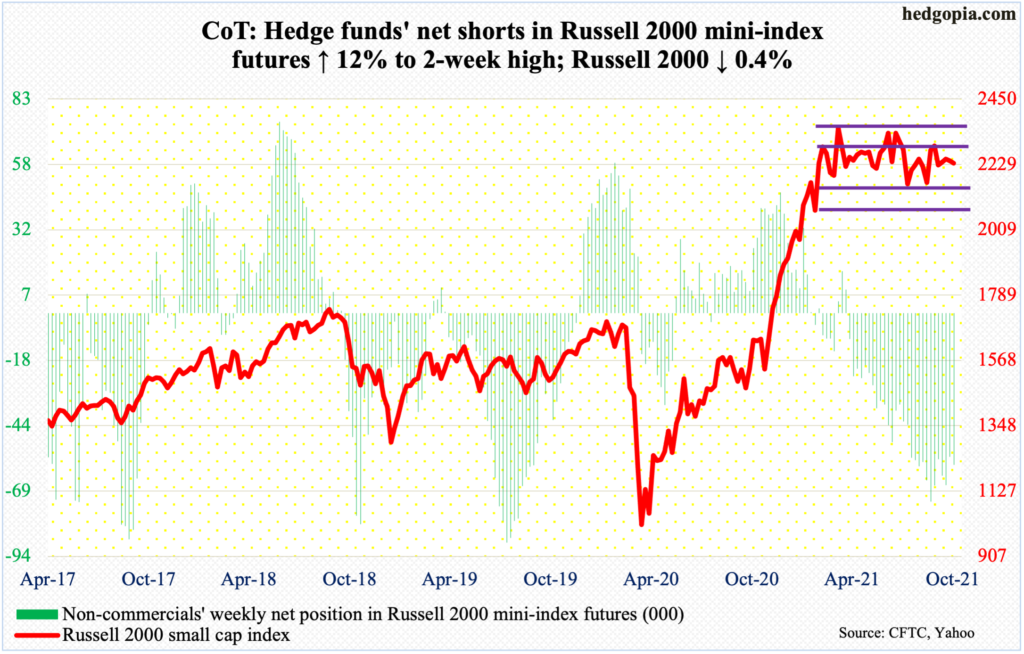
Small-caps had a subdued week when compared to their large-cap cousins. The Russell 2000 (2233) was down 0.4 percent for the week.
On Thursday, the small cap index rallied 1.6 percent, but this was not sufficient to even go test 2280s. The Russell 2000 has been rangebound between 2350s and 2080s for nearly seven months now. Within this rectangle lies another range between 2280s and 2150s. On Thursday, it rallied as high as 2265 before retreating.
The rangebound action continues, with several daily indicators right at the median. It could go either way near term.
US Dollar Index: Currently net long 32k, up 5.6k.
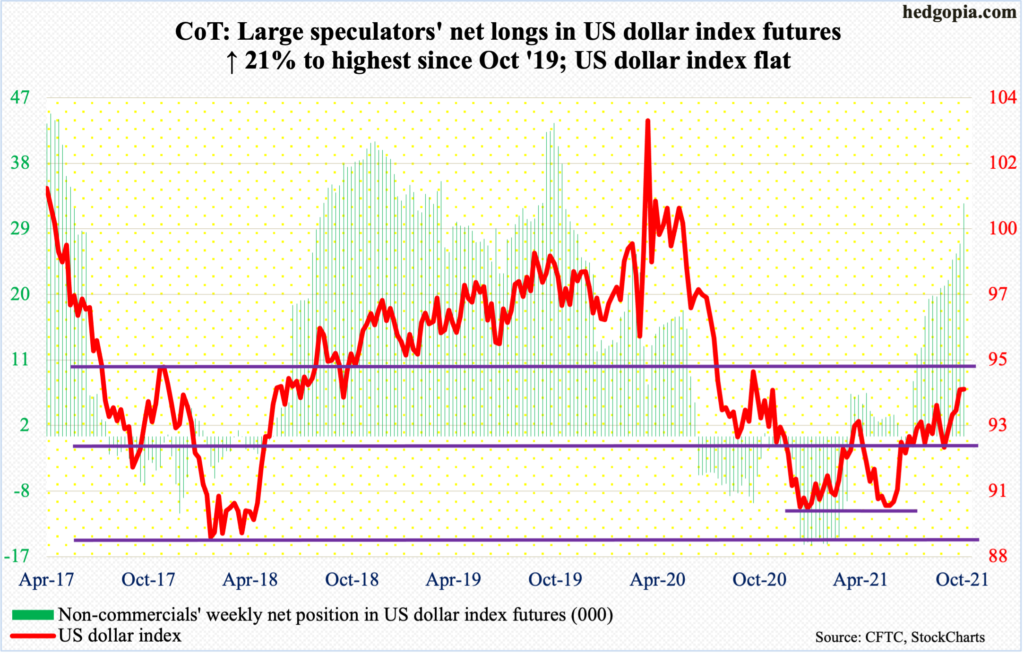
Last week’s breakout at 93.50s was just about tested this Monday as the US dollar index (94.08) tagged 93.68 intraday. Subsequently, it rose as high as 94.46 on Wednesday – close to testing last Thursday’s high of 94.52. Around 95 lies major resistance.
If it turns out Monday’s was a successful breakout retest, then dollar bulls would be one step closer to realizing 97-98; 93.50s makes up the neckline of a reverse-head-and-shoulders pattern. This could also be a W setup. The measured move of a breakout lies at 97-98.
Immediately ahead, signs of fatigue are appearing. Non-commercials are aggressively adding to net longs, which are at a two-year high. For the week, the US dollar index was flat as a pancake, forming a weekly long-legged doji.
VIX: Currently net short 69.6k, up 2.2k.
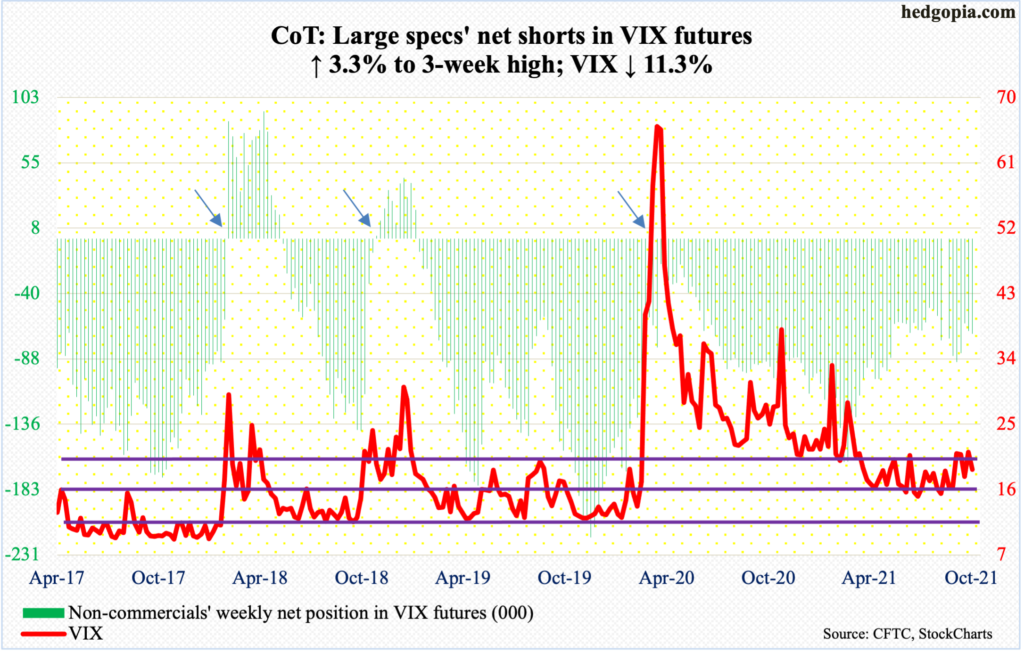
Weekly RSI turned back down from 55, which, barring in October last year and January this year, VIX (18.77) has been unable to overcome. This shows the tough time the volatility index is facing trying to sustain a rally. The latest attempt peaked on September 20 at 28.79. Since then, rallies persistently petered out at lower highs, including Wednesday’s 24.40.
That said, the daily RSI closed right at 50, and can rally. VIX closed the week slightly under the 50-day (18.87). A decisive breach opens the door toward 17, which is where a rising trend line from the June 29 low of 14.10 lies; as things stand, this is unlikely to yield.
Disclaimer: This article is not intended to be, nor shall it be construed as investment advice. Neither the information nor any opinion expressed here constitutes an offer to buy or sell any ...
more

