
Commitment Of Traders, Futures And Hedge Fund Positions - Sunday Jan. 17
Following futures positions of non-commercials are as of January 12, 2021.
10-year note: Currently net short 50.2k, up 77.9k.
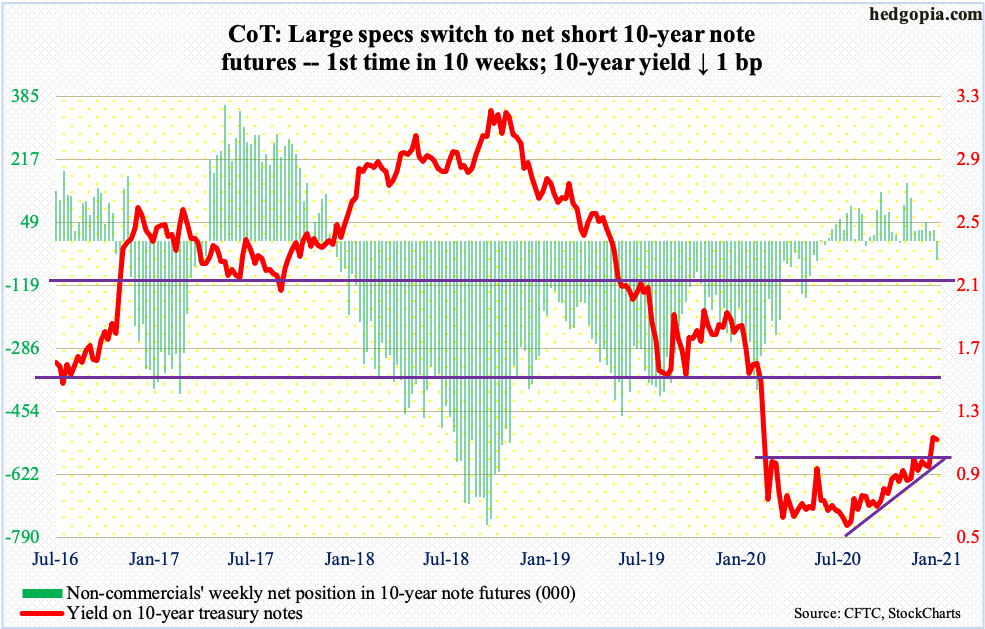
No sooner than the 10-year treasury yield rallied past one percent than several Fed officials, including Chair Jerome Powell on Thursday, were out in force trying to put the lid on budding tapering talk. Also on Thursday, president-elect Joe Biden announced a $1.9-trillion Covid relief plan.
Post-positive vaccine news from Pfizer (PFE) and Moderna (MRNA) – on November 9 and 16 respectively – investor optimism surrounding the US economy this year has firmed up; equities took another leg higher and bond prices fell.
With all that said, the 10-year (1.1 percent) yields barely north of one percent. As recently as August 2019, rates were north of two percent. Despite this, the fact that the Fed already felt it necessary to interject and declare that they will continue to purchase these securities shows how brittle things are. The Fed is currently buying $120 billion/month in mortgage-backed securities and treasury notes and bonds.
Given the leverage in the system – be it federal, corporate and household – the economy is not in a position to handle a sustained rise in interest rates. The Fed currently holds $2.03 trillion in MBSs and $4.02 trillion in treasury notes and bonds, up from $1.37 trillion and $2.03 trillion 10 months ago (last March). They are headed a lot higher.
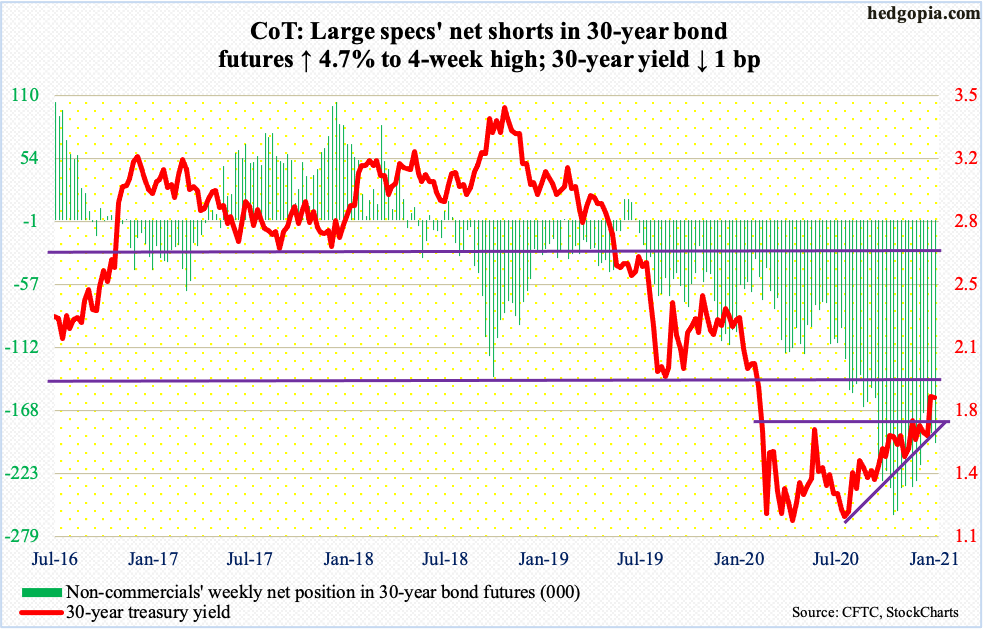
30-year bond: Currently net short 196.4k, up 8.9k.
Major economic releases for next week are as follows. Markets are closed Monday for observance of Martin Luther King, Jr. Day.
Treasury International Capital data (November) will be out Tuesday. In the 12 months to October, foreigners purchased $262.8 billion in US stocks – a record.
The NAHB Housing Market Index (January) is scheduled for Wednesday. Homebuilder confidence fell four points in December from November’s record 90. Post-Covid, confidence collapsed to 30 in April.
Housing starts (December) are due out Thursday. November starts rose 1.2 percent month-over-month to a seasonally adjusted annual rate of 1.55 million units – a nine-month high.
Friday brings existing home sales (December). Sales in November dropped 2.5 percent m/m to 6.69 million units (SAAR). In May, sales languished at 3.91 million.
WTI crude oil: Currently net long 565.3k, up 15.2k.
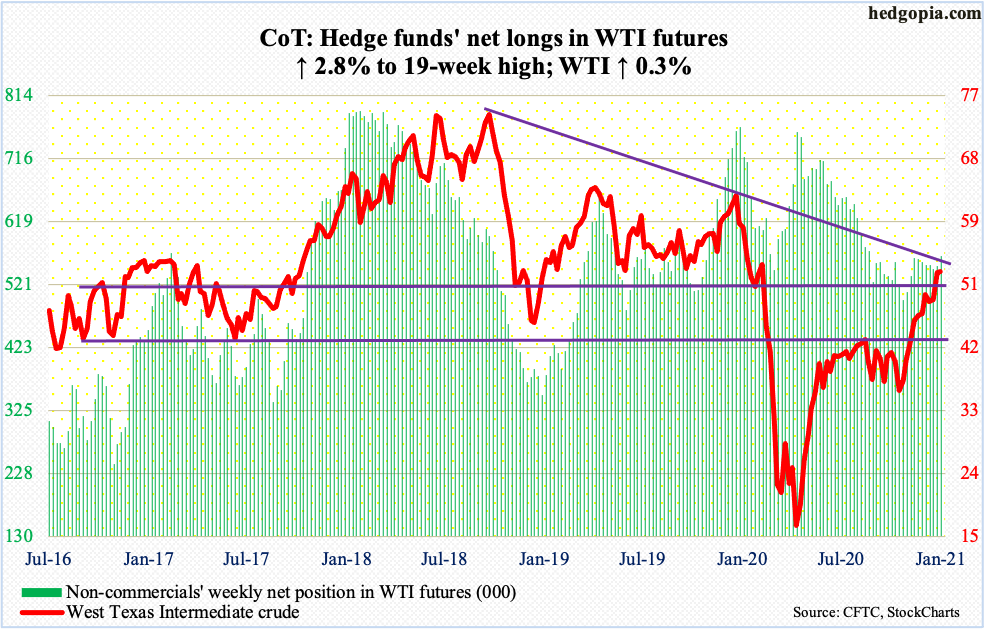
The $42-$43 breakout in late November brought more good news for oil bulls. Last week, WTI ($52.42/barrel) followed that up with a rally past horizontal resistance at $49-$50. This week, by Tuesday’s intraday high of $53.93, it rallied another 3.2 percent, but only to essentially give it all back by Friday – ending up 0.3 percent for the week. A doji showed up on the weekly. Sellers got aggressive on trend-line resistance from October 2018.
The crude has had quite a move since last March. Several technical indicators are screaming overbought. Rejection at the aforementioned trend line suggests the path of least resistance is down at least near term.
As far as US crude production is concerned, it remained unchanged in the week to January 8 at 11 million barrels per day – fifth straight week of output at that level, according to the EIA. Crude imports were up 870,000 b/d to 6.2 mb/d. As were stocks of gasoline and distillates – respectively up 4.4 million barrels and 4.8 million barrels to 245.5 million barrels and 163.2 million barrels. Crude stocks, however, declined 3.2 million barrels to 482.2 million barrels. Refinery utilization grew 1.3 percentage points to 82 percent.
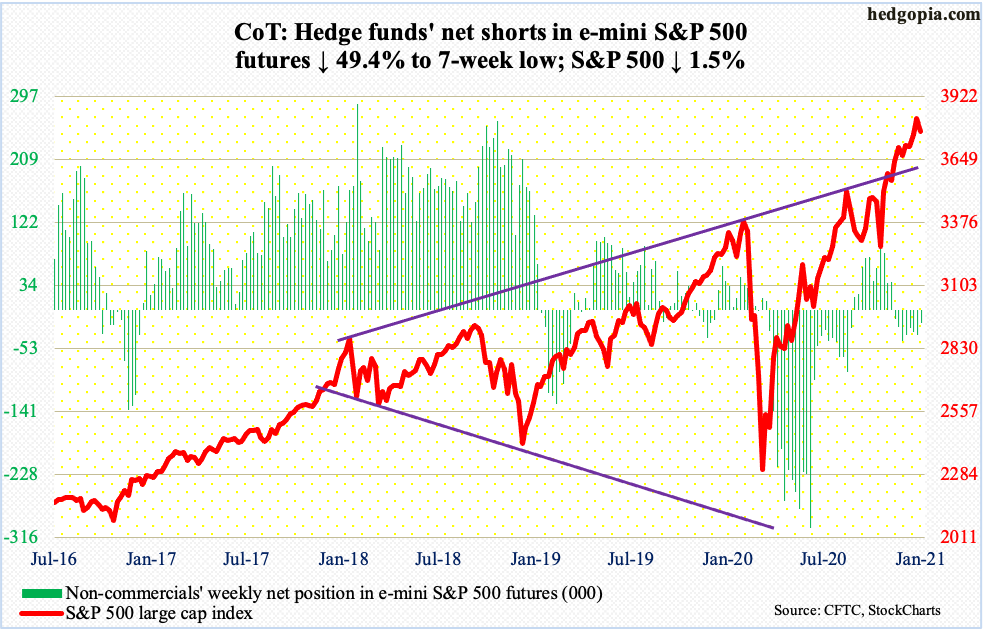
E-mini S&P 500: Currently net short 17.6k, down 17.2k.
US-based equity funds took in $5.4 billion in the week to Wednesday, offsetting outflows of the same amount in the prior week (courtesy of Lipper).
After last Friday’s all-time high of 3826.69, the S&P 500 traded with lethargy in the first four sessions this week, with a couple of dojis and a spinning top. By the end of the week, the large cap index shed 1.5 percent.
This week’s action follows a weekly hanging man last week. Amidst overbought technical conditions and elevated multiples (more on this here), bears may have a small opening here, but until they capture 3640s, which is where the index (3768.25) peaked on November 9 when PFE announced its positive vaccine news, they remain on the back foot.
Euro: Currently net long 155.9k, up 12.9k.
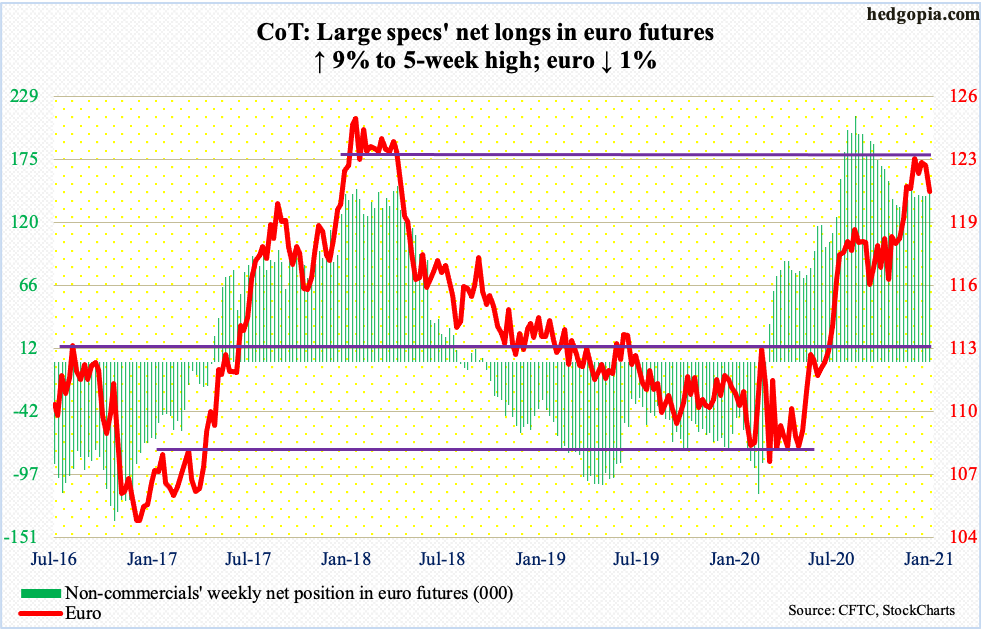
In a hanging man session last Wednesday, the euro tagged $1.2345 before retreating. This is a potentially bearish formation. Thus far, bulls have been on the defensive. The currency closed out the week at $1.2076, just above the 50-day at $1.2065.
Both the 10- and 20-day lie above, at $1.22, with a cross-under. Euro bulls’ mettle is being tested as resistance-turned-support at $1.20-$1.21 is being tested; this level was taken out in early December.
Gold: Currently net long 246.2k, down 33.1k.
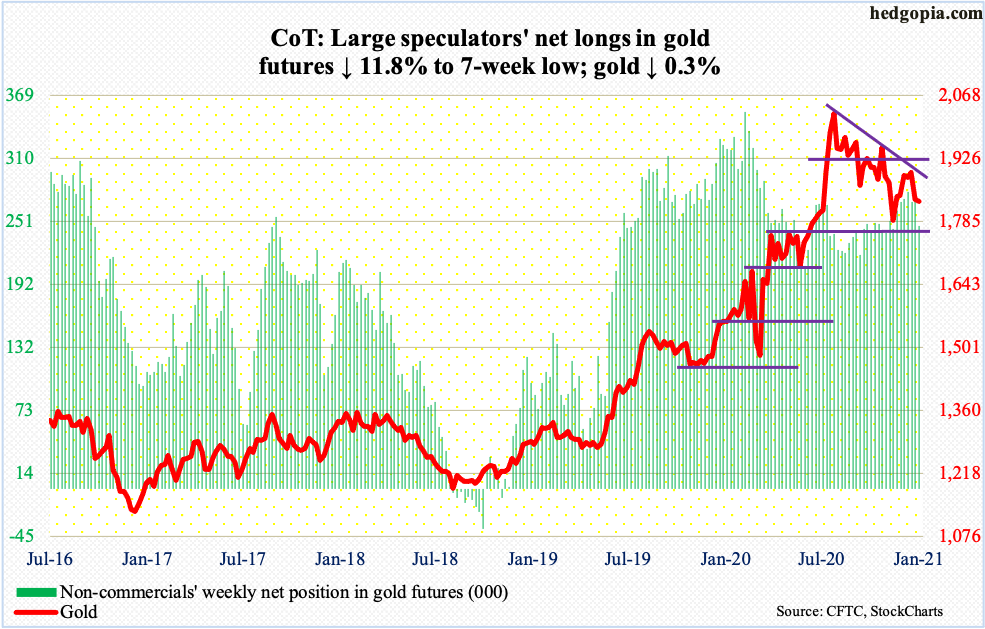
Last week, gold ($1,829.90/ounce) briefly retook crucial $1,920s, which is where it peaked back in September 2011, but only to lose it by close, slicing through its 50-day and slightly breaching the 200-day. This week, the metal straddled the latter average in the first four sessions before convincingly losing it on Friday. The average ($1,845.06) approximates horizontal support at $1,850s, whose loss raises the odds $1,760s-$1,770s gets tested in the sessions ahead.
Nasdaq 100 index (mini): Currently net long 20.4k, down 5.4k.
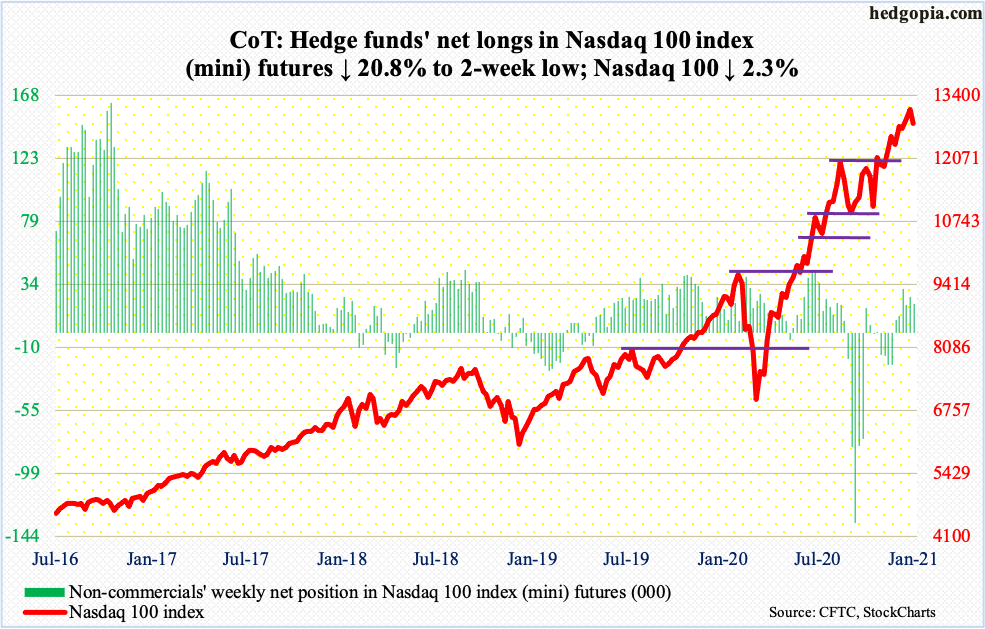
After last week’s weekly hanging man, the Nasdaq 100 (12803.93) this week remained under last Friday’s all-time high of 13113.09. This is score one for tech bears. Concurrently, shorter-term averages seem to want to roll over. In the sessions ahead, 12430s is worth watching; this is where the Nasdaq 100 peaked back on September 2 and which coincides with the 50-day at 12436.46.
Russell 2000 mini-index: Currently net long 15.1k, down 18k.
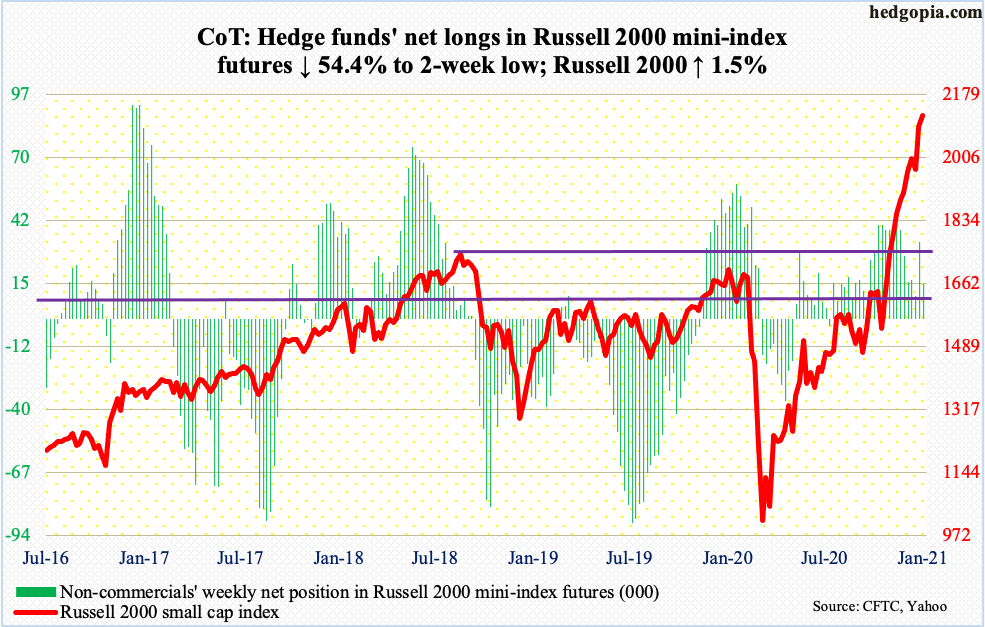
In the week to Wednesday, IJR (iShares Core S&P Small-Cap ETF) gained $137 million. This was the 11th consecutive weekly flows for a total of $2.8 billion. During that time (going back to early November), IWM (iShares Russell 2000 ETF) had two negative weeks for cumulative inflows of $8.7 billion, including $1.5 billion in the latest week (courtesy of ETF.com).
The Russell 2000 bottomed late October/early November. Post-November 3 presidential election and particularly after positive vaccine news from PFE and MRNA, investors heavily gravitated toward small-caps. This continues. The small cap index rallied 1.5 percent this week, even as larger-cap indices such as the S&P 500 and the Nasdaq 100 declined.
Having bottomed at 960s last March, the Russell 2000 (2123.20) has more than doubled. Conditions are way extended, with the index 38.5 percent above its 200-day on Thursday. But, barring some in isolation, there is no sustained distribution. Rather, the move has come in a stair-step fashion (more on this here). Immediately ahead, there is new support at 2110s, and 2020s after that.
US Dollar Index: Currently net short 13.9k, down 1k.
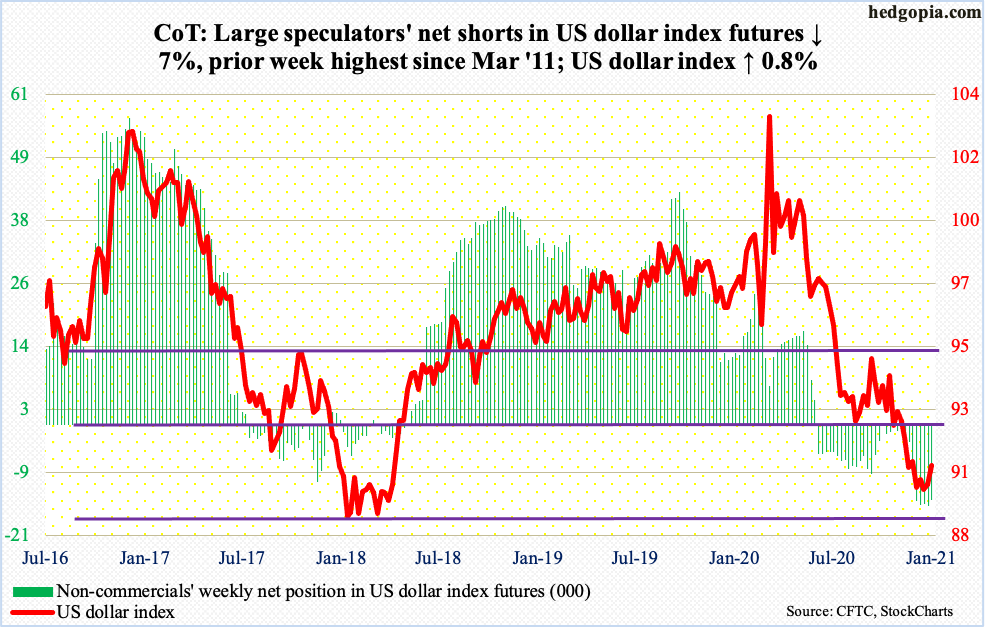
So far so good. Last week’s weekly hammer reversal is working out fine for dollar bulls. In a spinning top session last Wednesday, the US dollar index (90.75) tagged 89.17 intraday. That was the lowest since April 2018. Support at 88-89 goes back to at least March 2004.
That said, the index remains in a downtrend; last March, it peaked at 103.96, subsequently losing one after another support, including 92, which gave way in late November. This level is where the real test lies, not to mention the 50-day at 91.11 before that.
VIX: Currently net short 117.6k, up 11.6k.
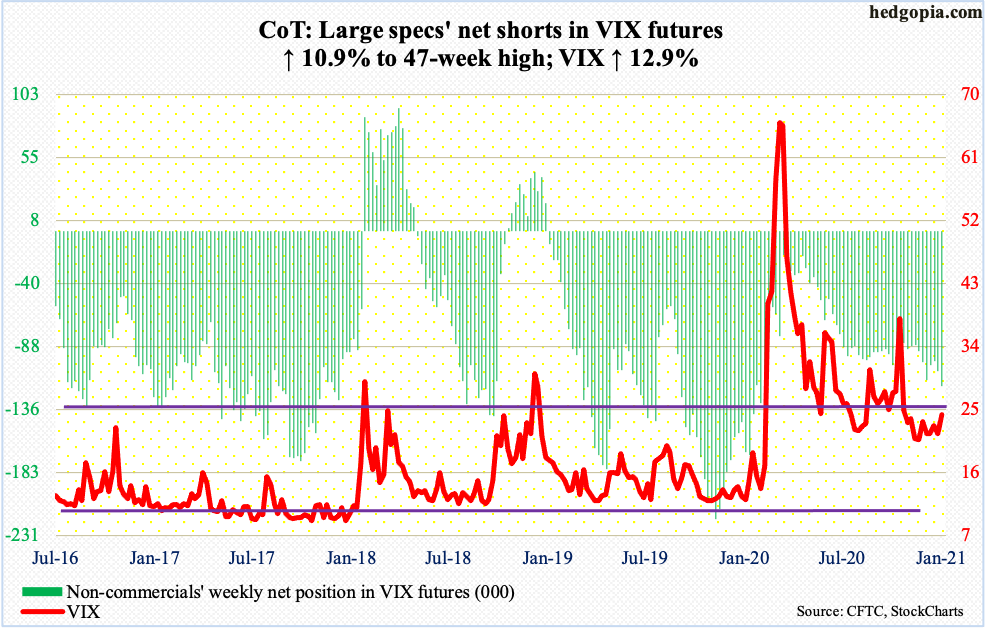
Once again, volatility bulls stepped up in defense of a rising trend line from late November. Thursday’s low of 21.66 on VIX (24.34) was vigorously defended. The problem is that they have been unable to sustain the rallies.
On Monday last week, the intraday high of 29.19 was rejected just short of the 200-day. This was preceded by a failed rally attempt on December 21 when the session high 31.46 was vehemently denied at that average.
From volatility bulls’ perspective, the good thing is that low-20s refuses to crack even though the S&P 500 is trading near its highs. On Friday, the 50-day was recaptured. Next comes straight-line resistance at mid-20s, followed by the 200-day (now 28.23).
This blog is not intended to be, nor shall it be construed as, investment advice. Neither the information nor any opinion expressed here constitutes an offer to buy or sell any security or ...
more

