
Commitment Of Traders: A Look Into The Near Future
Following futures positions of non-commercials are as of July 21, 2020.
10-year note: Currently net long 29k, down 29.1k.
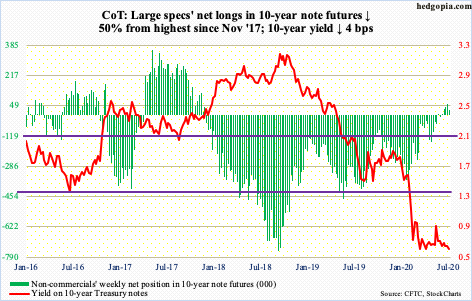
Tuesday (July 26), the FOMC begins a two-day meeting. This will be the fifth of eight scheduled meetings this year. There were two unscheduled ones in March. On the 23rd that month, the Fed kicked off unlimited QE and said it would begin buying investment-grade corporate bonds, which on April 9 was expanded to also include high-yield.
The balance sheet, which already began growing in late August last year, went from $4.24 trillion early March to $7.17 trillion early June. Interestingly, post-February/March collapse, US equities bottomed on March 23, rallying 47.5 percent through June 8 and then stalling. Interestingly – once again – the Fed’s balance sheet peaked on the week to June 10. It then took the S&P 500 five weeks to surpass the June 8th high, which was short-lived. Thursday, the index tagged 3279.99 and closed out the week at 3215.63.
From the June 10th peak, the balance sheet contracted $248.2 billion in the next four weeks, before adding $44 billion to this week’s $6.96 trillion. Arguably, stocks are not liking the downward trend. That said, assets are still up $2.7 trillion from early March.
Equity bulls are convinced of a Fed backstop. The Fed itself is convinced of a wealth effect. The only question is, what is the threshold – the S&P 500 down 10 percent, 15 or 20? The index is merely 5.5 percent from its February record high – probably not enough for the Fed to get panicky about. There will be no handouts in next week’s meeting.
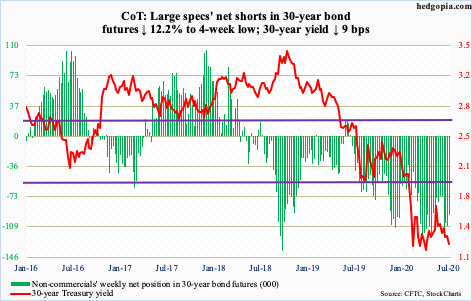
30-year bond: Currently net short 95.1k, down 13.2k.
Major economic releases next week are as follows.
Durable goods orders (June) come out Monday. Orders for non-defense capital goods ex-aircraft – proxy for business capex plans – rose 1.6 percent month-over-month in May to a seasonally adjusted annual rate of $62.3 billion. This preceded three straight m/m declines from January’s $66.8 billion.
The S&P/Case-Shiller home price index (May) is scheduled for Tuesday. Nationally, home prices increased 4.7 percent year-over-year in April – a 17-month high.
GDP (2Q20, first print) will be published Thursday. As of July 17, the Atlanta Fed’s GDPNow model is forecasting a contraction in real GDP of 34.7 percent. In 1Q, the economy shrank five percent.
Friday brings personal income/spending (June), the employment cost index (2Q20) and the University of Michigan’s consumer sentiment index (July, final).
In the 12 months to May, core PCE – the Fed’s favorite measure of consumer inflation – rose 1.02 percent – the lowest rate of growth since December 2010.
In 1Q20, total comp for private industry workers increased 2.8 percent y/y. This was the fastest pace of growth in four quarters.
Preliminarily in July, consumer sentiment fell 4.9 points m/m to 73.2. In February, the index hit 101.
WTI crude oil: Currently net long 655.8k, up 1.2k.
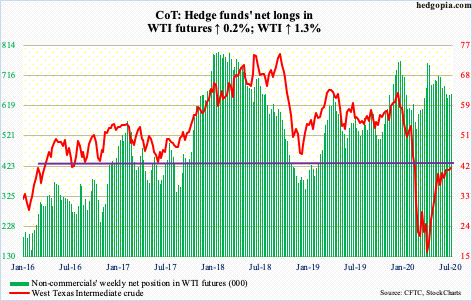
One more week of sideways action on WTI – right around its 10- and 20-day moving averages. The crude ($41.29/barrel) vacillated between $39.97 (Monday) and $42.51 (Tuesday). WTI entered this consolidation mode after it filled an early-March gap nearly seven weeks ago. This was preceded by an intraday low of $6.50 on April 21.
Even after the massive rally the past three months, the weekly RSI is struggling to convincingly lift above the median. Concurrently, daily Bollinger bands have tightened quite a bit, which usually precedes a sharp move – either up or down. For now, the risk is to the downside.
The EIA report for the week to June 17 was not of much help this week. After remaining flat at 11 million barrels per day for four weeks, US crude production rose to 11.1 mb/d. Crude stocks increased 4.9 million barrels to 536.6 million barrels. As did distillate stocks, which rose 1.1 million barrels to 177.9 million barrels. Refinery utilization edged down two-tenths of a percentage point to 77.9 percent. Crude imports rose as well, up 374,000 b/d to 5.9 mb/d. Gasoline stocks, however, fell 1.8 million barrels to 246.7 million barrels.
E-mini S&P 500: Currently net short 43k, up 14.4k.
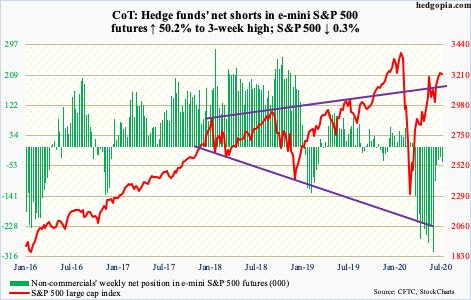
After filling a gap from June 11 two weeks ago, bulls hurriedly went after the June 8th high of 3233.13. Monday, the S&P 500 (3215.63) comfortably surpassed that threshold, tagging 3279.99 by Thursday but the momentum was short-lived; by Friday, the index was pushed under it.
For bears to wrest momentum away from bulls, they need to decisively push the price below a rising trend line from the March low, with the index having essentially closed out the week sitting on it. A breach of this support opens the door to testing the 50- and 200-day – respectively at 3104.14 and 3041.34 – and horizontal support at 2950s.
In the meantime, a respectable $3.8 billion moved into SPY (SPDR S&P 500 ETF), VOO (Vanguard S&P 500 ETF) and IVV (iShares Core S&P 500 ETF) in the week to Wednesday (courtesy of ETF.com). In the same week, $746 million went into US-based equity funds, versus outflows of $50.9 billion in the prior five (courtesy of Lipper).
Euro: Currently net long 125k, up 14.1k.
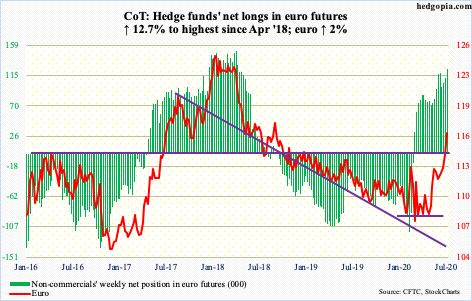
On March 9, the euro ($116.57) reversed strongly lower after touching $114.85. On June 10, the currency again reversed lower after tagging $114.25. Both of those reversals occurred in spinning top sessions. Bulls continued to hammer on this last week – unsuccessfully. Their perseverance paid off Tuesday this week when the euro powerfully broke through this ceiling.
The euro currently is at the highest level since September 2018. Non-commercials could not have ridden this any better. This week, they took their net longs to the highest since April 2018.
Gold: Currently net long 266.4k, up 4k.
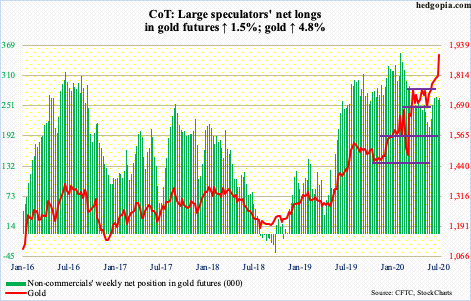
Gold ($1,897.50/ounce) is within spitting distance from taking out the prior high of $1923.70 from September 2011. On Friday, it tagged $1,904.60 intraday. The metal rallied in all five sessions this week for a 4.8 percent move – on a relatively stronger volume.
Five weeks ago, after trying for 11 straight weeks, gold broke out of $1,750s. Throughout this – in fact, even leading up to this – flows into gold-focused ETFs were very healthy. In the 18 weeks to Wednesday, IAU (iShares Gold Trust) gained $5.1 billion without one down week; GLD (SPDR Gold ETF), on the other hand, had one session of outflows, for a total haul of $16.6 billion (courtesy of ETF.com).
The way the yellow metal pushed higher this week, it now has solid support at $1,790s.
Nasdaq 100 index (mini): Currently net long 15.7k, down 19.9k.
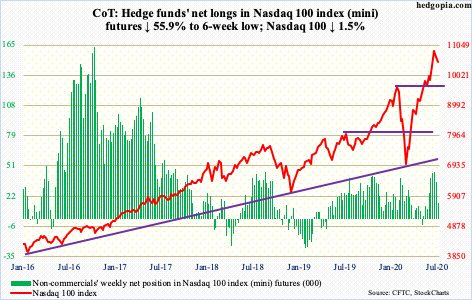
Last week, the Nasdaq 100 (10483.13) reversed lower to form an outside week. This week, Tuesday’s intraday high of 11017.43 was the closest tech bulls came in testing last Monday’s record high 11069.26.
The index rallied massively from the March low and into 2Q earnings, having surged 63.5 percent through the July 13th high. Based on post-earnings reaction to Microsoft (MSFT), IBM (IBM), Tesla (TSLA) and Intel (INTC), it is turning out to be a ‘buy the rumor, sell the news phenomenon’.
Next week, the remaining four of the top five largest US companies – Facebook (FB), Apple (AAPL), Amazon (AMZN) and Alphabet (GOOG) – report. Customarily, the bar is low for them to jump over, but the fact remains that bulls have a lot of gains sitting on paper. The urge to lock them in becomes greater once tech momentum breaks. There are subtle signs this is happening (more on this here).
This week, the Nasdaq 100 lost both the 10- and 20-day.
In 10 sessions through the aforementioned record high, the Nasdaq 100 shot up 13.6 percent intraday; the low on June 29 was a successful test of the prior high from February. This will get retested around 9800.
Russell 2000 mini-index: Currently net short 3.3k, up 7.8k.
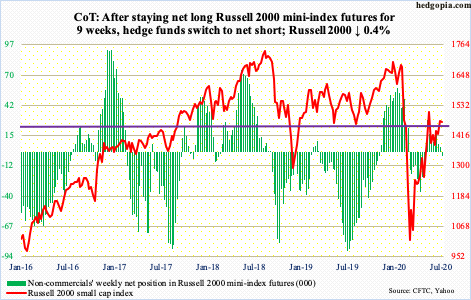
There is a tremendous push-pull going on between bulls and bears around 1450s-60s on the Russell 2000 (1467.55). After several attempts since late May, bulls finally pushed through this ceiling last week. Importantly, this is where the 200-day (1467.27) lies as well.
Late last week and early this week, bulls stepped up to defend the breakout, but have so far been unable to decisively slingshot off of it. That said, until bears reclaim 1450s-60s, bulls deserve the benefit of the doubt.
Amidst this bull-bear tug of war, non-commercials switched to net short this week.
US Dollar Index: Currently net short 5.8k, up 754.
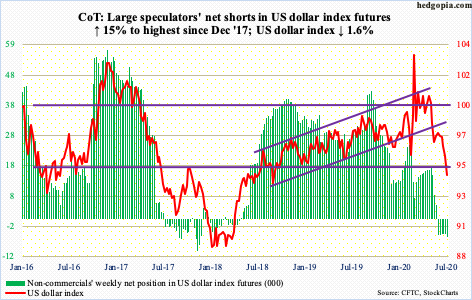
After getting denied at 97.50s for several sessions late last month, the US dollar index came under persistent attack. Until Monday this week, dollar bulls were able to save 95.70s. Support around this level goes back at least five years. Come Tuesday, it was gone. By Thursday, the index (94.38) was testing the March 9th low of 94.61, which was breached Friday. Just underneath, around 94, lies a rising trend line from May 2011 when the US dollar index bottomed at 72.70. It is a make-or-break.
VIX: Currently net short 95.2k, up 6.9k.
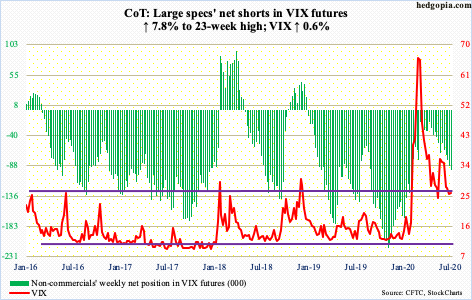
VIX lost the 200-day (26.79) last Friday. An attempt to reclaim the average was denied pretty much throughout this week, including Friday when the volatility index lost 0.24 in a down session for the S&P 500. The average also approximates a falling trend line from March 18 when VIX (25.84) peaked at 85.47. Hence the significance of where it is at currently.
Once this roadblock is taken care of, the 50-day lies at 29.47. After that comes 36-37, which, should it fall, will have significantly raised the odds of higher volatility.
In the meantime, the 10-day moving average of the CBOE equity-only put-to-call ratio printed 0.43 on Tuesday – the lowest ever – with Friday at 0.46. It is quite frothy out there (more on this here).


