
Claims Up But Still Low
Initial jobless claims this week rose slightly up to 205K from 203K last week which was the lowest reading this indicator had reached since its lows from last spring. While this week marked the first uptick in nearly a month, the actual reading was still well below estimates for an increase to 210K. This leaves jobless claims at the bottom of the past year’s range and still only 12K above its recent low of 193K from April of last year. In other words, this week’s increase was overall not that bad as claims still remain at very healthy levels.
(Click on image to enlarge)

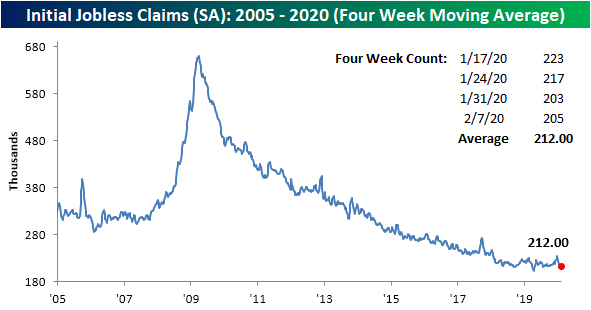
The moving average, which helps to smooth out the week to week fluctuations of the high-frequency data, went unchanged this week at 212K. This is a result of this week’s 205K number replacing an equivalent reading from five weeks ago. That marks the first time that the moving average did not move up or down week-over-week since November of 2017. As with the unmanipulated data, although it is not quite there yet, the moving average is sitting at some of its lowest levels since April’s multi-decade lows.
(Click on image to enlarge)
Non-seasonally adjusted jobless claims continue to experience their seasonal decline following the peak that was put in place in the first weeks of the new year. Claims fell to 219K this week from 224.7K last week. That is the lowest level for non-adjusted claims for the current week of the year of the current cycle.
(Click on image to enlarge)

Continuing jobless claims, which are lagged one week from initial claims data, have also begun to tick lower recently after rising sharply in the past few months. This week’s reading fell from 1751K to 1698K which was larger than the expected reading of 1734K. This week’s drop also marked the first time since November that continuing claims fell below 1700K. Additionally, we recently have highlighted how continuing claims have begun to show persistent YoY increases over the past few months for the first time of the current cycle. Now, this is not a massively negative sign as such readings have been observed outside of recessionary periods in the past (like the early 2000s shown below), but it is something that raises a flag. The past few weeks have given some relief to this as continuing claims are beginning to tick lower year-over-year again as shown in the second chart below.
(Click on image to enlarge)

Start a two-week free trial to Bespoke Institutional to access our interactive economic indicators monitor and much ...
more

