
Claims Breathe A Sigh Of Relief
The past couple of weeks’ releases for jobless claims have been a bit concerning. Last week and the week before, initial jobless claims ran up to 227K. That was not only the highest level since June 21st’s 229K, but it also marked a distinct breakout above the past several months’ range. Released a day earlier than usual due to the Thanksgiving holiday tomorrow, this week’s claims gave reason to be thankful as they came in at a much healthier level falling to 213K compared to forecasts of a decline to 221K. That 15K decline was the largest since May 10th’s 16K drop. This has also led the indicator to fall back into the middle of the range that it had broken out of in the prior two weeks.
(Click on image to enlarge)

Given this week’s decline, the four-week moving average has also fallen. The moving average, which helps to smooth out the week to week fluctuations, is now at 219.75K, and it is the first time the moving average has dropped in three weeks. This is another welcome sign as recent readings have been at the upper end of its downtrend channel.
(Click on image to enlarge)

On a non-seasonally adjusted (NSA) basis, claims data was not quite as rosy.NSA claims rose this week by 24.5K up to 252.4K. While week-over-week upticks could be expected this time of year due to seasonal factors, the 33.7K increase versus last year’s reading was more of a surprise. Not only was the NSA data higher than it was one year ago, but it is higher than the current week of the year in 2017 as well. Additionally, this was the largest YoY increase for any week since December 6th, 2013 when it rose 34.2K.
(Click on image to enlarge)
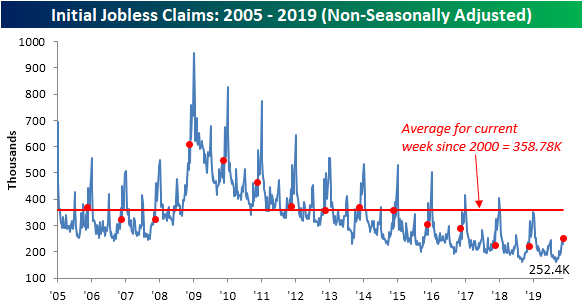
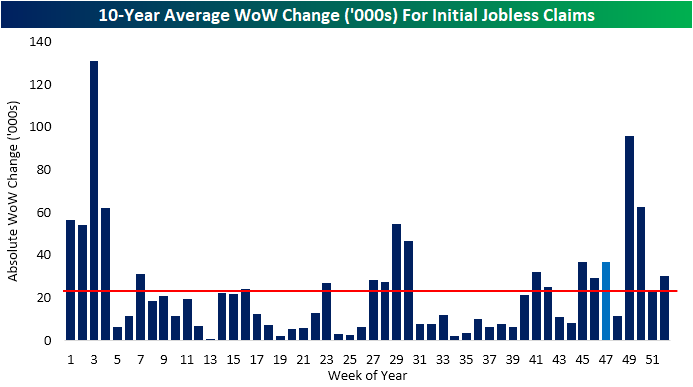
While those increases are notable, it should still be taken with a grain of salt as one week does not make a trend and it could come down to seasonal factors including the timing of Thanksgiving. This time of year has historically been volatile for claims, meaning comparisons of the same week number between different years is not an exact science. To highlight the volatility of this year, in the past decade November through January typically sees some of the largest week-over-week changes (in absolute terms) of the year. This week of the year (light blue bar) is no exception as it too has typically seen a larger than average move than the average for all weeks of the year (red line). Perhaps a better read on how things stack up versus one year ago will come several weeks down the line once claims have put in their seasonal peak.
(Click on image to enlarge)
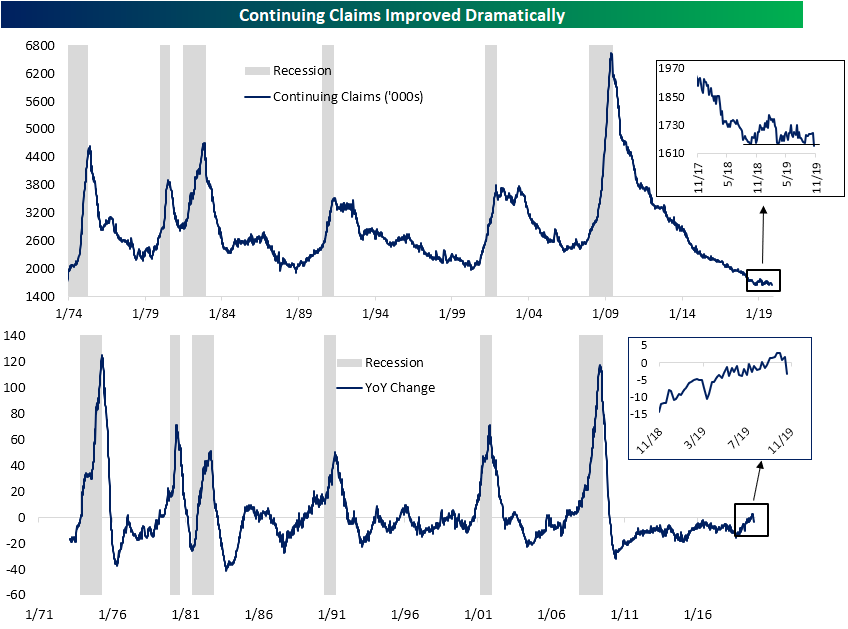
Additionally, that concerning uptick in the NSA data is idiosyncratic with other labor data released today. Continuing jobless claims experienced a substantial improvement this week as they fell to 1640K compared to forecasts of 1691K and last week’s revised 1697K. That 57K decline was the largest since a 62K decline in April of this year; around the time of multidecade lows for claims. This week’s print not only broke to new lows of the past couple of years (inlaid chart below), but it was also the lowest reading on continuing claims since early August of 1973. As shown in the second chart, Continuing claims are down 55K relative to last year, which is the largest YoY decline since July. It also provides a nice break from the increases that have been observed over the past few weeks for the first time this cycle (which we discussed last week).
(Click on image to enlarge)
Start a two-week free trial to Bespoke Institutional to access our interactive economic indicators monitor and much ...
more

