
Chart Analysis: Sell Home Depot (HD) Here
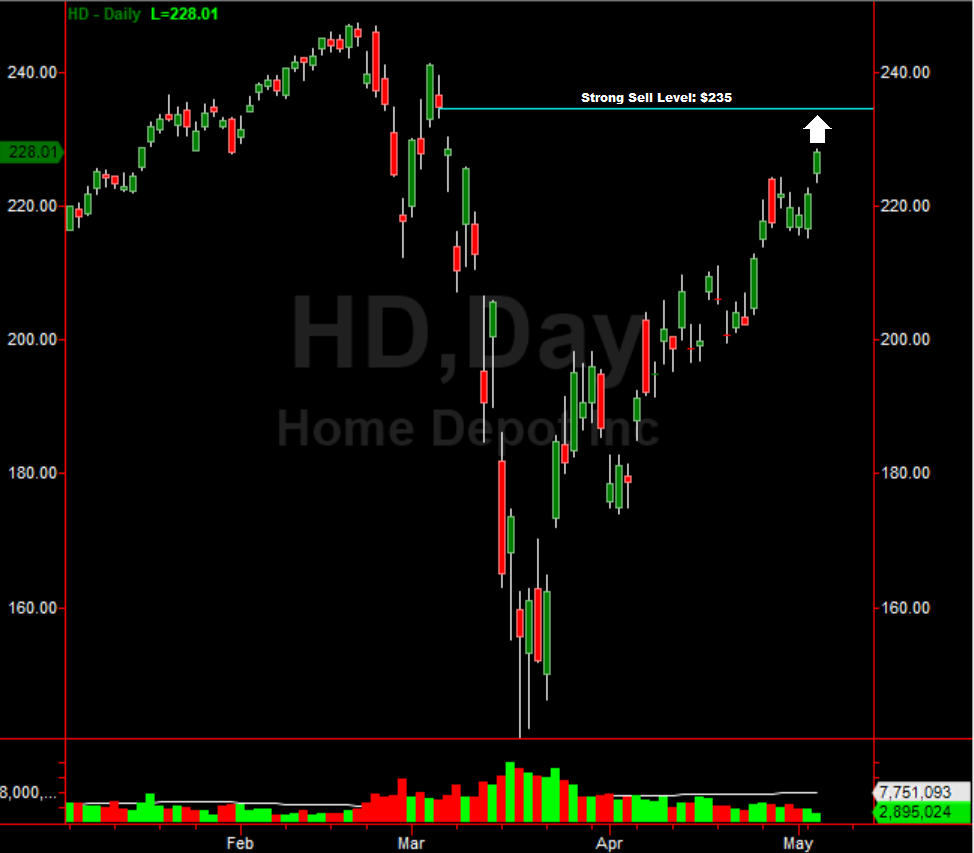
Shares of Home Depot (HD) continue to grind higher in a market that seems overly resilient as the economy remains mostly shutdown. As a technical trader, there is a strong sell Home Depot signal at $235.00. When analyzing the chart, investors must note that the $235.00 sell Home Depot signal is right at a major gap fill resistance point. In addition, take note of the up-move the stock has had in the last 2 months. After bottoming out in mid-March at $140.00, Home Depot has surged back to nearly $230.00 as of today. That is a more than 50% move higher with almost no down moves of significance. Looking at the MACD and Stochastics, they are both showing signals of being near-term overbought as well.
Please note this is a swing trade short opportunity, only when Home Depot reaches $235.00. Swing trades are quick trades usually meaning the investor is in and out within days to weeks. The sell Home Depot signal is strong and looks well worth a trade.
(Click on image to enlarge)
Disclosure: None.


