
CGC Canopy Growth Corporation Wave Analysis
First, I would like to mention the Canopy Growth Corporation stock only began trading on the NYSE last year due to legal reasons. That said I am not going to talk about any fundamentals or financials of the stock. I do think the stock is bullish although this view I present is purely technical. It would offer a reasonable entry area if it works out as the data is suggesting thus far. There is data readily available back toward 2014 that suggests share price was pretty close to penny stock territory.
Second, from the aforementioned all time lows the cycle higher from there ended on Oct. 16. From there the cycle lower into the Oct. 13 lows looks like a five wave Elliott Wave impulse. Furthermore it was strong enough to suggest it was correcting the all time cycle higher. Then from the Oct. 30 lows the stock bounced into the Nov. 7 red wave A highs which was a three swing move. At that point there was a possibility that was all of the connector wave that would separate two impulse waves as you would see in a ziz-zag Elliott Wave correction. Looking from the Nov. 7 high into the Dec. 24 lows appears to be a three swing move as was the previous wave A cycle. It was also short of the area equal legs to 123.6 Fibonacci extension area. This area is highlighted on the lower right part of the chart.
The analysis continues below the chart.
CGC Daily Chart
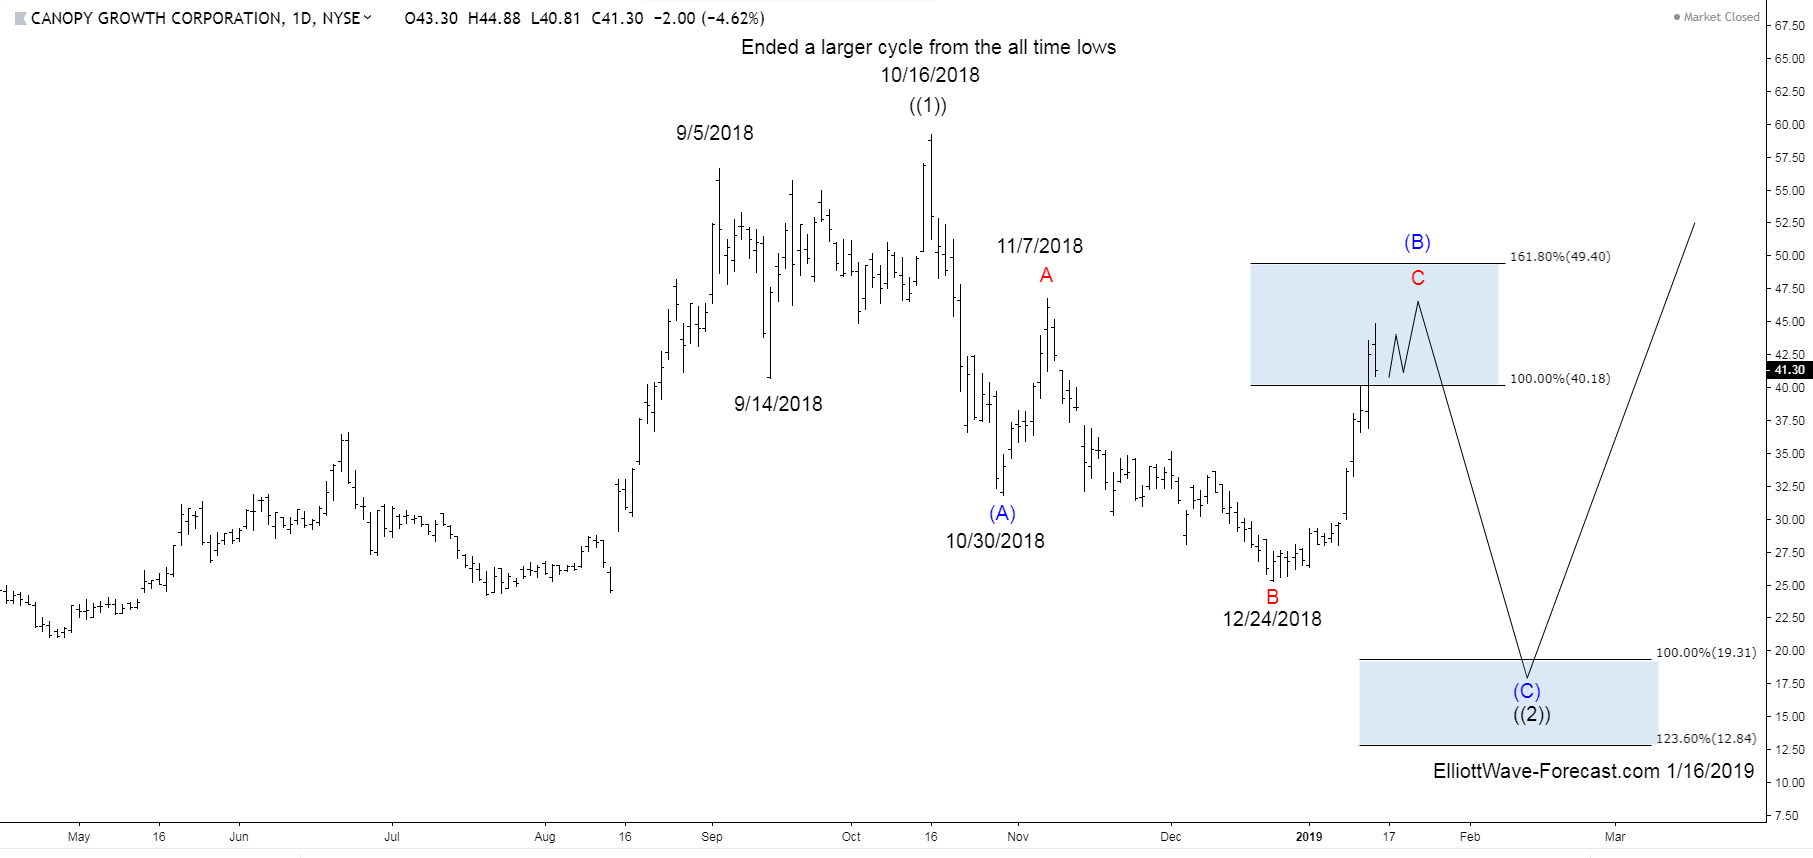
Third, the bounce from the Dec. 24 lows appears to be a five wave impulse so far however I think it is incomplete. The dip from the high on Jan. 5 is already deep enough for a typical wave four. Anything from the highs on sideways to lower on down to just above the 36.50 area could be seen. It should see another marginal high to complete five waves up from the Dec. 24 lows before a turn back lower.
Conclusion
The bounce from the Dec. 24 lows so far exhibits all qualities of an impulse in the red C. The two previous cycles in the red A & B were three swing moves being followed by an impulse. This suggests the blue wave (B) connector as a whole is a 3-3-5 flat structure. In turn if this is the case the stock should see another leg lower like the blue wave (A) once the blue wave (C) happens. Presuming the blue wave (B) ends near this Nov. 7 high; The target area on the lower right part of the chart can provide a good long opportunity.
Disclaimer: Futures, options, and over the counter foreign exchange products may involve substantial risk and may not be suitable for all investors. Leverage can work against you as well as for ...
more

