
CB Leading Economic Index: Full Recovery From COVID Contraction
The latest Conference Board Leading Economic Index (LEI) for April was up 1.6% from the March final figure of 111.5.
The Conference Board LEI for the U.S. increased for a second consecutive month in April, after a small dip in February. The LEI registered positive contributions from most of its components, while the average weekly manufacturing hours and manufacturers’ new orders for nondefense capital goods excluding aircraft* components remained unchanged. In the six-month period ending April 2021, the leading economic index increased 4.7 percent (about a 9.6 percent annual rate), slower than the growth of 11.8 percent (about a 24.9 percent annual rate) during the previous six months. In addition, the strengths among the leading indicators have remained very widespread.
The Conference Board CEI for the U.S., a measure of current economic activity, continued to rise in April. The coincident economic index rose 1.1 percent (about a 2.1 percent annual rate) between October 2020 and April 2021, slower than the growth of 11.0 percent (about a 23.2 percent annual rate) over the previous six months. The strengths among the coincident indicators have remained very widespread, with all components advancing over the past six months. The lagging economic index also increase in April, but at a higher rate than the CEI. As a result, the coincident-to-lagging ratio fell slightly. Real GDP expanded at a 6.4 percent annual rate in the first quarter of the year, after increasing 4.3 percent (annual rate) in the last quarter of 2020. More
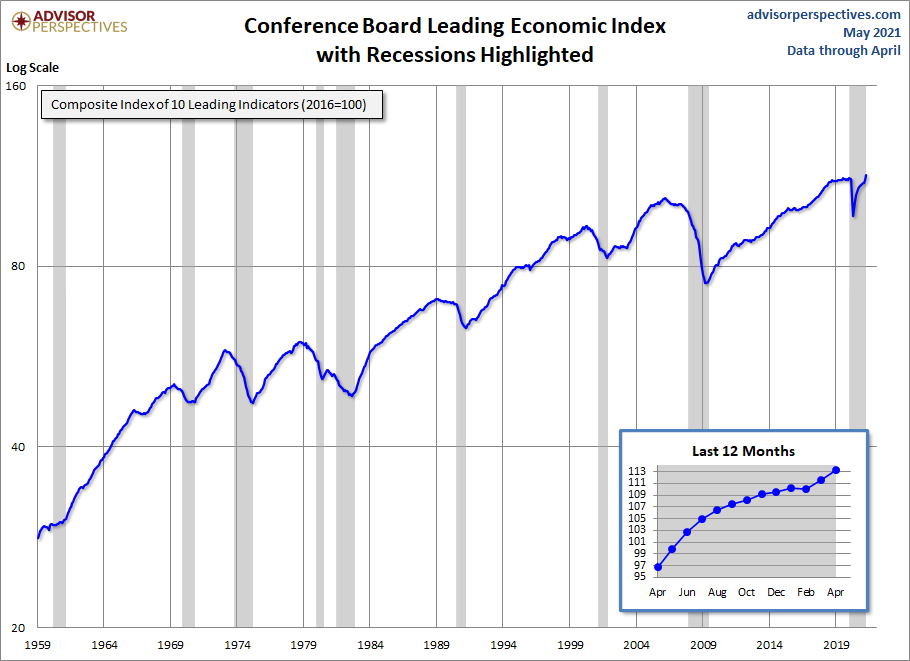
Here is a log-scale chart of the LEI series with documented recessions as identified by the NBER. The use of a log scale gives us a better sense of the relative sizes of peaks and troughs than a more conventional linear scale.
For additional perspective on this indicator, see the latest press release, which includes this overview:
NEW YORK, May 20, 2021…The Conference Board Leading Economic Index® (LEI) for the U.S. increased by 1.6 percent in April to 113.3 (2016 = 100), following a 1.3 percent increase in March and a 0.1 percent decline in February.
“With April’s large monthly gain to start the second quarter, the U.S. LEI has now recovered fully from its COVID-19 contraction—surpassing the index’s previous peak, reached at the very onset of the global pandemic in January 2020,” said Ataman Ozyildirim, Senior Director of Economic Research at The Conference Board. “While employment and production have not recovered to their pre-pandemic levels yet, the U.S. LEI suggests the economy’s upward trend should continue and growth may even accelerate in the near term. The Conference Board now forecasts real GDP could grow around 8 to 9 percent (annualized) in the second quarter, with year-over-year economic growth reaching 6.4 percent for 2021.”
For a better understanding of the relationship between the LEI and recessions, the next chart shows the percentage-off the previous peak for the index and the number of months between the previous peak and official recessions.

LEI and Its Six-Month Smoothed Rate of Change
Based on suggestions from Neile Wolfe of Wells Fargo Advisors and Dwaine Van Vuuren of RecessionAlert, we can tighten the recession lead times for this indicator by plotting a smoothed six-month rate of change to further enhance our use of the Conference Board's LEI as a gauge of recession risk.

As we can see, the LEI has historically dropped below its six-month moving average anywhere between 2 to 15 months before a recession. Here is a twelve-month smoothed out version, which further eliminates the whipsaws:

The Conference Board also includes its Coincident Economic Index (CEI) in each release. It measures current economic activity and is made up of four components: nonagricultural payroll, personal income less transfer payments, manufacturing and trade sales, and industrial production. Based on observations, when the LEI begins to decline, the CEI is still rising. Here's a chart including both the CEI and LEI.

Here is a chart of the LEI/CEI ratio, which has also been a leading indicator of recessions.


