
Canadian Bank ETFS – The Best Bank ETFS In Canada
Canadian banks are not only some of the best stocks to buy in Canada, but in the world.
During the 2008 financial crisis, Canadian bank stocks were one of very few that didn’t cut or suspend their dividend. Sure, they didn’t raise dividends, but at least they kept their heads above water. Along with this, most of the Canadian banks stock prices were back to pre-crash prices within a year or two.
As such, there is a huge demand for Canadian bank ETFs. Canadians and investors all around the world want a piece of Canada’s Big 5 banks, as they are recognized as some of the best dividend-paying stocks in the world. All of the Canadian banks within these ETFs are Canadian Dividend Aristocrats as well, signaling more than 5 straight years of dividend growth.
Investors who are worried about buying the wrong stock or those who don’t want to constantly balance a portfolio of individual stocks can look towards these Canadian bank ETFs for instant diversification across Canada’s six biggest banks.
Are the fees worth it with these Canadian bank ETFs?
There are definitely arguments to be made that the expense ratios of these Canadian bank ETFs just aren’t worth it. With minimal holdings, these ETFs can be mimicked in an individual portfolio for as little as $30 in commission costs.
And while we do agree that even a small amount of time every year could have you managing Canada’s 6 biggest banks on an individual level in your portfolio, those new to investing or those who simply don’t want to deal with their portfolios will find these bank ETFs extremely useful.
And, our final 2 banks ETFs provide a unique spin in the form of covered calls to accelerate your returns and provide higher distributions. And because they are actively managed this way, we can expect higher fees. As long as those higher fees translate into better results (which they have) we’re OK with it.
Just keep in mind, that you’ll be paying at minimum $5.50 a year per $1000 invested for these ETFs.
Let us go over some of the best Canadian bank stock ETFs to be looking at in 2020.
BMO Equal Weight Banks Index ETF (TSX: ZEB)
| STOCK | % ASSETS |
|---|---|
| National Bank of Canada (NA) | 18.60 |
| Bank of Montreal (BMO) | 17.10 |
| Royal Bank of Canada (RY) | 16.24 |
| CIBC (CM) | 16.21 |
| TD Bank (TD) | 15.89 |
| Bank of Nova Scotia | 15.75 |
Price: $30.17
Yield: 3.67%
Expense Ratio: 0.55%
NAV: 30.07
Net Assets: $1.09 Billion
5 Yr Return: 10.67%
Canada's Best Dividend Stocks Going Into 2020
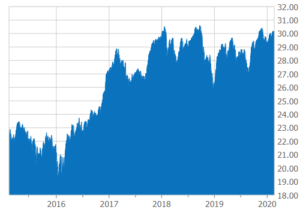
The BMO Equal Weight Banks Index ETF (TSX: ZEB) aims to track the 6 largest financial institutions here in Canada. In fact, that’s all this Canadian bank ETF has in terms of holdings.
The overall objective of the ETF is to duplicate the performance of the Solactive Equal Weight Canada Banks Index. The ETF contains all of the same holdings as the Index, along with the same proportions of each holding.
The ETF pays a yield of 3.67% at the time of writing and actually has very impressive overall returns. Created in 2010, this Canadian bank ETF has put up a 10 year average return of 11.09% annually, not including dividends. The funds most productive year was in 2016, where it gained nearly 31% over the course of the year.
If you’re looking for the simplest, most direct way to invest in Canada’s banks, then this bank ETF is for you. However, there are a few downsides.
For one, it’s a management fee. The ETF currently has an expense ratio of 0.55%. While this is still relatively low, we must take into consideration that the fund is only managing 6 holdings. An individual investor could replicate these positions for as little as $30 in commission on a brokerage like Questrade.
Secondly, an equal-weighted investment in all of the holdings within this portfolio would produce an average yield of around 4.32% at the time of writing. With this Canadian bank ETF, you yield 3.67%.
So, although this is a good option for investors who want absolutely nothing to do with individual stock picks, the fees and lower dividends can be quickly avoided by simply purchasing the 6 stocks in the ETF.
BMO Covered Call Canadian Banks (TSX: ZWB)
| STOCK | % ASSETS |
|---|---|
| BMO Equal Weight Banks ETF | 28.71 |
| National Bank of Canada (NA) | 13.29 |
| Bank of Montreal (BMO) | 12.20 |
| Royal Bank of Canada (RY) | 11.51 |
| CIBC (CM) | 11.42 |
| Bank of Nova Scotia (BNS) | 11.41 |
| TD Bank (TD) | 11.28 |
Price: $18.94
Yield: 5.49%
Expense Ratio: 0.65%
NAV: 18.89
Net Assets: $1.83 Billion
5 Yr Return: 9.28%
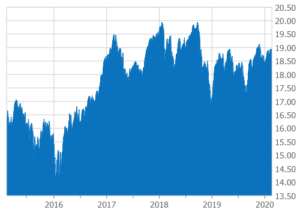
Canadian investors that are looking for a bank ETF that pays a lucrative dividend, look no further than the BMO Covered Call Canadian Bank ETF (TSX:ZWB). This ETF invests in the same holdings as our previous ETF ZEB. In fact, ZWB contains the Equal Weight Banks Index ETF. It accounts for around 28.7% of the fund.
The key difference is the fact that the fund generates more income for investors by writing covered call options. What’s a covered call? We’ll go over a very brief explanation.
A “call” is a type of options contract, and the “covered” portion is an options strategy where the investor owns the underlying stock.
The investor (the fund in this case) will sell call options for the same number of shares (or less) that they own. With a call option, you agree to sell the shares determined within the contract for a specific dollar value, if it hits that price point.
You get paid a premium for selling the contract, and ultimately if the contract expires, you keep your shares and the premium. If the buyer exercises the contract, you sell the shares for the agreed price.
Covered call options are arguably the safest way to trade options, and someone who is skilled in the strategy can lower their overall volatility.
Currently the bank ETF pays around 5.49% in dividends on a monthly basis and has some fairly strong returns. The fund started in 2012, so ten year averages are not available yet but the ETFs 5 year annual return is 9.28% not including dividends.
This puts ZWB right in line with ZEB in terms of overall returns when you factor in the dividends.
With the bank ETF utilizing covered calls, there is obviously more work involved to manage the fund. And as such, the management fee is higher compared to ZEB at 0.65%.
Our next (and last for Canadian banking ETFs) ETF follows a similar strategy.
CI First Asset CanBanc Income Class ETF (TSX:CIC)
| STOCK | % ASSETS |
|---|---|
| National Bank of Canada (NA) | 21.24 |
| Royal Bank of Canada (RY) | 18.05 |
| TD Bank (TD) | 18 |
| Bank of Montreal (BMO) | 15.17 |
| CIBC (CM) | 13.15 |
| Bank of Nova Scotia (BNS) | 12.73 |
Price: $11.71
Yield: 6.09%
Expense Ratio: 0.84%
NAV: 11.70
Net Assets: $153.23 Million
5 Yr Return: 8.94%
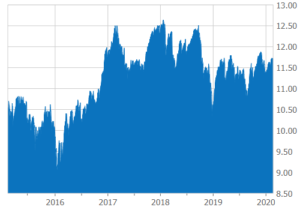
Much like ZWB, CI First Asset CanBanc Income Class (TSX: CIC) aims to track the returns of Canada’s major financial institutions all while generating more income through the sale of covered call options.
There are a few key differences between this bank ETF and ZWB however, so lets go over those first.
For starters, this ETF’s holdings do not contain underlying ETFs like the BMO Covered Call Canadian Bank ETF did.
Much like the ETFs we’ve discussed prior, it contains 6 stocks, National Bank and Canada’s Big 5.
The ETF has also taken a different approach in terms of the weighting of the holdings. While the two previous ETFs contained a relatively equal weighting, CIC has allocated a larger portion to National Bank, Royal Bank, and TD Bank.
The bank ETF also pays out its dividend on a quarterly basis rather than monthly and allocates a maximum number of shares the fund can sell call options on (25%). So, if the fund holds 100 shares of Royal Bank, they are restricted to selling covered calls for only 25 shares.
The ETF pays a yield of 6.09% and has a 5-year annual return of 8.94%. Over the last five years, with dividends included this has been Canada’s best ETF that focuses primarily on banking stocks. However, its expense ratio is 0.84%, costing you $8.40 per $1000 invested each year.
So, which Canadian bank ETF is right for you?
The bank ETF that’s right for you depends largely on your risk tolerance and willingness to pay fees.
While CIC and ZWB engage in covered calls to increase the ETF’s returns, the management fees are also higher. Keep in mind as well, that ZWB’s largest holding is actually ZEB!
In terms of ZEB, like we mentioned, there is a few downsides. Individual purchases with equal weighting among all the holdings within the ETF would have you yielding just over 0.50% more, and would take very little time to balance. In the end, the ETF will end up costing you $5.50 in management fees per $1000 invested, along with a loss in dividends of $5 annually a year compared to owning the stocks outright.
If you believe the fees are worth the cost of admission with these ETFs, then take advantage of owning the biggest stocks in one of the strongest industries in the world in a single click.
Disclaimer: You can read our full disclaimer here.


