
Buying The Dip Versus Selling Now: The Key Factor To Watch
The bull market in stocks is reaching record proportions, and prices seem to defy all kinds of concerns. In this scenario, investors have reasons to wonder if they should be buying stocks to ride the bull market higher or selling positions in anticipation of a turnaround.
Chasing prices at these levels is clearly too dangerous and should be avoided. However, as long as liquidity conditions are favorable and money is flowing smoothly through the economy, short-term pullbacks should be considered buying opportunities.
The Most Important Driver For The Bull Market
The trade war, the slowdown in manufacturing, the military conflicts in the Middle East, the coming elections and political risk, expensive valuations, and declining earnings expectations are just some of the many risk factors that have been considered as potential threats to the bull market.
However, markets have continued to perform well in spite of all this uncertainty. This rock-solid resiliency is mostly due to the fact that the Fed and other central banks all over the world are providing massive amounts of liquidity, and such liquidity is flowing smoothly across both the real economy and financial markets.
The chart below shows the evolution of the S&P 500 versus the size of the major central banks' balance sheets. An image is worth a thousand words, and it's easy to see how liquidity and asset prices are closely related.
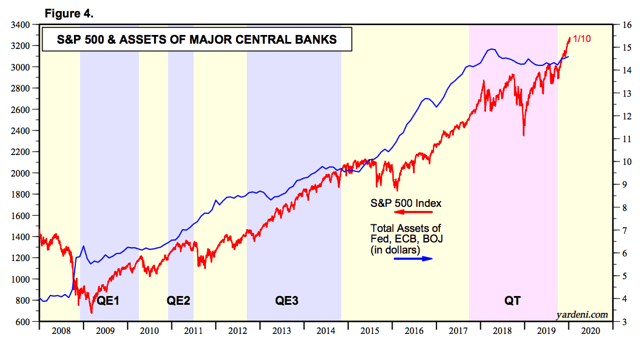
Source: Yardeni Research
When companies have access to cheap credit, this provides the resources to make all kinds of investments, and also to distribute capital to investors through dividends and buybacks.
The chart below shows the relationship between the S&P 500 and high yield credit spreads, with shaded areas representing recessions. The big bear markets in stocks generally come during recessions, and recessions generally happen when credit spreads are increasing. In a nutshell, recessions and bear markets tend to happen when liquidity is no longer flowing through the economy.
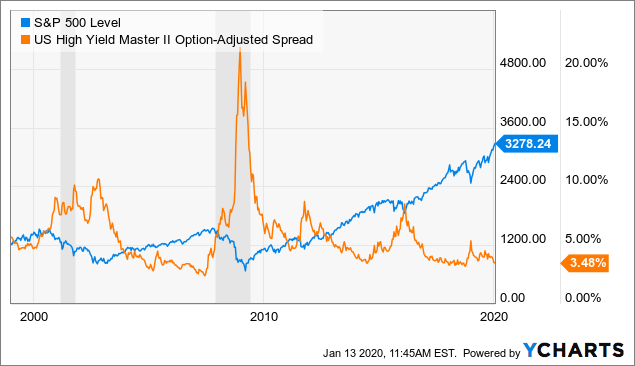
Data by YCharts
If economic activity is slowing down but credit conditions remain healthy and inflation is subdued, the Fed can always provide more monetary stimuli when it needs to do so. This can boost consumer spending, while also providing more flexibility for corporations.
In this context, chances are that interest rates will remain low and economic slowdowns will be moderate, and this is a bullish environment for the stock market.
Market prices will still have short-term pullbacks and corrections during long-term bull markets. However, those pullbacks are generally buying opportunities as opposed to big bear markets.
Conversely, when you have a credit crunch or even a full-blown financial crisis, chances are that recessions will be far more severe, and the decline in stock prices considerably deeper.
Quantifying The Relationship Between The Credit Markets And The Stock Market
One of the models that I generally watch closely to assess market conditions is the Credit Market Model. This is a quantitative strategy that rotates between stocks and bonds by reading the signals from the credit market. The main idea is having strong exposure to stocks when credit conditions are favorable and protecting the portfolio when the credit market is providing reasons for caution.
This is done by creating a ratio that measures the relative performance of iShares iBoxx $ High Yield Corporate Bond (NYSEARCA:HYG) versus iShares 7-10 Year Treasury Bond ETF (NASDAQ:IEF).
When this ratio is rising, it means that high-yield bonds are outperforming Treasury bonds, so risk appetite is increasing in the credit markets, and credit spreads for high yield bonds are typically contracting. Rising risk appetite in the bond markets is usually good for stocks too.
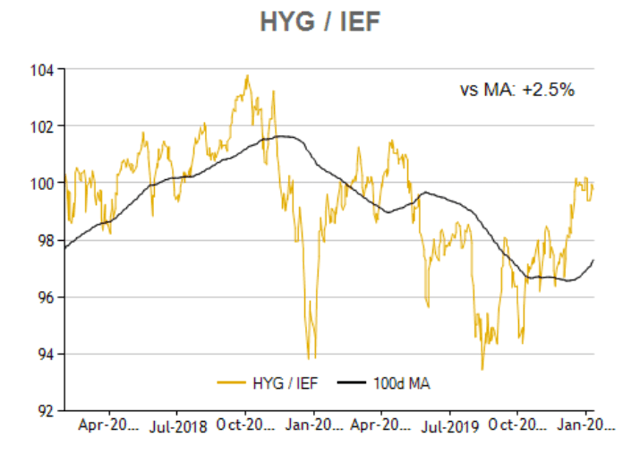
Source: ETFreplay
When the ratio is above the 100-day moving average, meaning in risk-on mode, the strategy is invested in the SPDR S&P 500 Trust ETF (SPY). Alternatively, when the ratio is in the risk-off mode, the strategy buys the iShares 20+ Year Treasury Bond ETF (TLT) to protect the portfolio.
The chart shows the backtested performance statistics for the quantitative strategy versus a buy-and-hold position in a benchmark that includes 60% stocks and 40% bonds.
Since January 2008, the first full year in which all of the ETFs in the strategy are available for trading, the quantitative strategy gained 454.6% versus a cumulative gain of 93% for the benchmark in the same period.
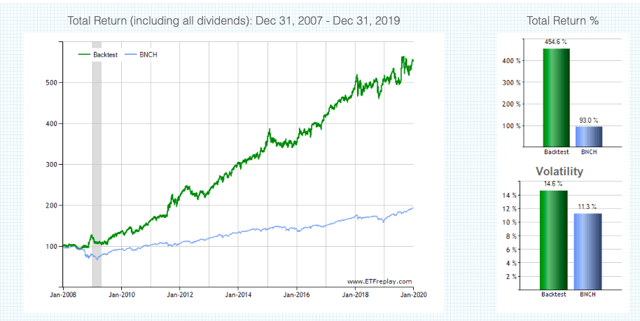
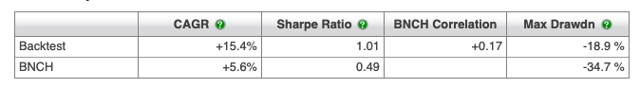
Source: ETFreplay
The annual return is 15.4% for the strategy versus 5.6% for the benchmark. More importantly, the maximum drawdown, meaning the greatest percentage drop from the high, is 18.9% for the quantitative strategy versus 34.7% for the benchmark.
The strategy has produced solid returns with moderate risk over the long term, but it's important to understand that future returns will depend on market conditions to a good degree.
In times when treasuries and high yield bonds are moving sideways, the strategy will probably produce many false signals. Besides, when there is a rapid reversal in risk appetite, it will take some time for the strategy to read the signals from the credit market and adjust the portfolio risk.
On the other hand, when there are well-defined trends in risk appetite in the bond market, either up or down, the quantitative strategy should be able to do a solid job at capturing these trends and benefiting from them.
In simple terms, the strategy measures trends in the credit markets to make risk management decisions across stocks and bonds. When those trends are strong and long-lasting, the strategy will produce attractive performance. But when trends are weak and rapidly changing in direction, the strategy will most probably generate disappointing returns.
Reading The Data
Since October-November of last year, the Credit Market Model has been sending bullish signals for stocks. And these signals are being confirmed by rising prices in equity markets. If we look at credit conditions in general, it's easy to see that the environment is quite favorable to risk-on assets such as equities.
Source: ETFreplay
At times when stocks are making new highs, high yield credit spreads are also making new lows. This means that the price action in the credit market is supporting the bull market in stocks.
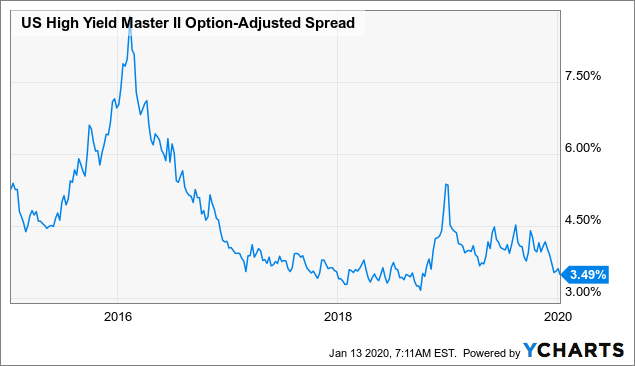
Data by YCharts
Looking at past history, every time that the US economy entered a recession in the past, this has been signaled in advance by a big increase in loan delinquencies, which is obviously reflecting problems in the credit markets. The picture looks quite solid right now, with delinquencies at historical lows.

Source: Federal Reserve
The National Financial Conditions Index provides a comprehensive weekly update on US financial conditions in money markets, debt and equity markets and the traditional and "shadow" banking systems. Positive values indicate financial conditions that are tighter than average, while negative values indicate financial conditions that are looser than average.
Looking at the most recent data, financial conditions are clearly very loose.
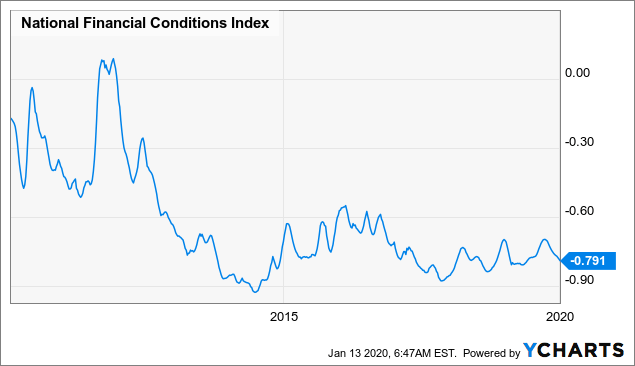
Data by YCharts
The Bottom Line
With the main market indexes rising strongly and making all-time highs as of the time of this writing, I wouldn't go chasing for stocks at these levels. In previous articles I have covered the fact that the market is overbought in the short term, and an adjustment of 5% to 10% should come as no surprise in this context.
But there is a big difference between a 5%-10% correction during a bull market and a new bear market with declines of 25%-35% or even more. A small correction in a bull market is a buying opportunity for long-term investors, while a full-blown bear market is a reason to sell.
This is why making plans is remarkably important. Corrections only feel natural until they happen. In the midst of a market decline, you never know how low prices will go, and it is difficult to make smart decisions in times of fear and uncertainty. You need to analyze market conditions in advance so that you can make a consistent plan and manage your portfolio accordingly.
The main point is that when liquidity is flowing smoothly through the real economy and through financial markets, declines tend to be relatively shallow and ultimately buying opportunities, and this is the case in the current environment.
Roman philosopher Seneca is credited for saying that "Luck is what happens when preparation meets opportunity." Now is the time to do your homework and understand the main drivers in this bull market, so that you can differentiate between a buying opportunity and change in fundamental market conditions.
A correction is increasingly likely in the short term. But, as long as liquidity keeps flowing well in the markets, such a correction should be considered a buying opportunity as opposed to a reason to sell stocks.
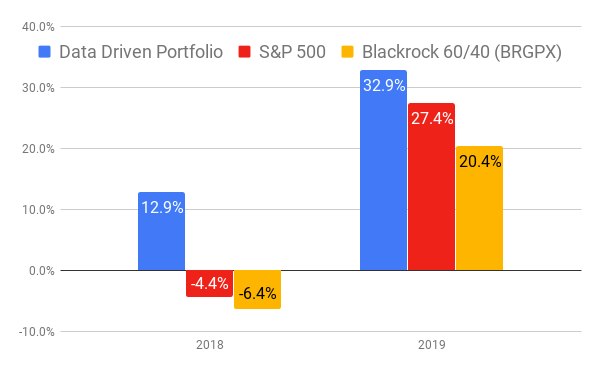
Performance as of December 31, 2019
Disclaimer: I wrote this article myself, and it expresses my own opinions. I am not receiving compensation for it. I have no business relationship with any company whose stock is mentioned in ...
more

