
Business Cycle Indicators As Of Mid-September
Industrial production finally rises above levels in 2020M02 (the latest NBER peak). We now have the following picture of the macroeconomy (for some key indicators followed by the NBER’s BCDC).
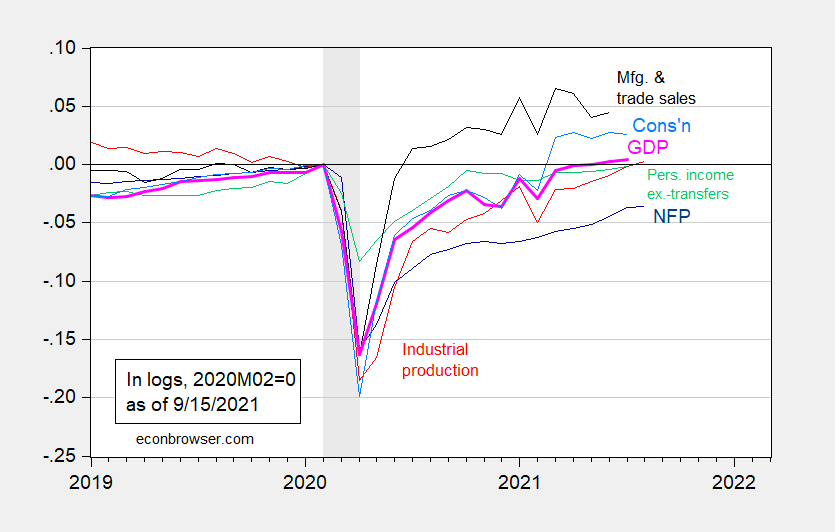
Figure 1: Nonfarm payroll employment from August release (dark blue), industrial production (red), personal income excluding transfers in Ch.2012$ (green), manufacturing and trade sales in Ch.2012$ (black), consumption in Ch.2012$ (light blue), and monthly GDP in Ch.2012$ (pink), all log normalized to 2020M02=0. NBER defined recession dates shaded gray. Source: BLS, Federal Reserve, BEA, via FRED, IHS Markit (nee Macroeconomic Advisers) (9/1/2021 release), NBER, and author’s calculations.
Industrial production hit the Bloomberg consensus, while manufacturing production, at 0.2% m/m, missed the consensus 0.4%.
Interestingly, industrial production has not yet exceeded the prior peak achieved in August 2018; the same is true of manufacturing production (August 2018 is a month after Section 301 tariffs were imposed on China).
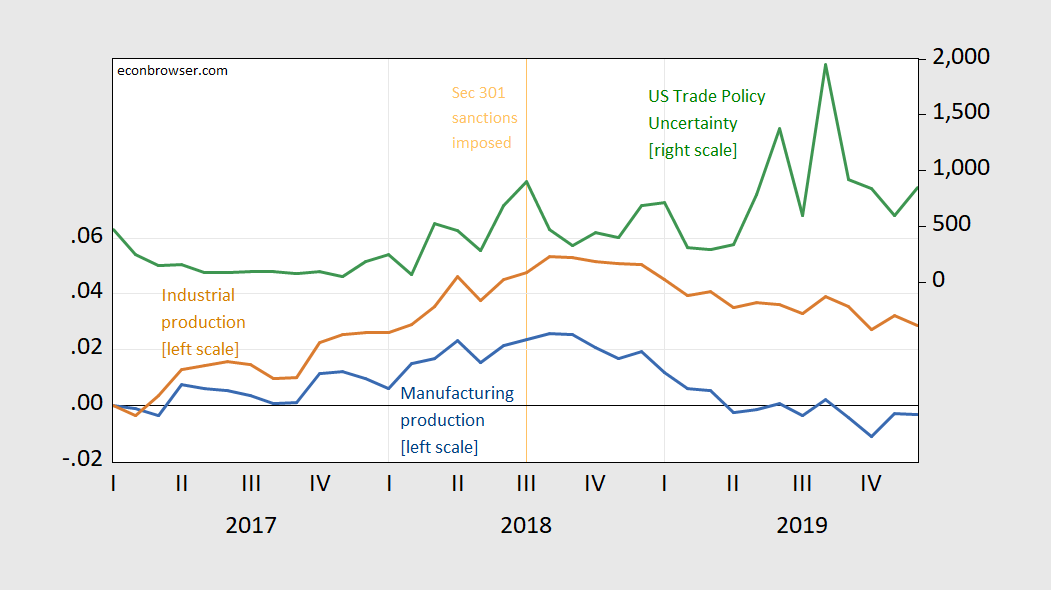
Figure 2: Manufacturing production (blue, left scale), industrial production (tan, left scale), both in logs, 2017M01=0; and US Trade Policy Uncertainty (green, right scale). Source: Federal Reserve via FRED, policyuncertainty.com, and author’s calculations.
Correlation is not causation — but you got to wonder. (And, we have formal analyses linking the trade wars generally to reductions in employment in the manufacturing sector, as discussed e.g., here).
You can see how China has met — or not met — its commitments in the Phase 1 US-China trade agreement here.
The foregoing suggests to me a managed two-sided de-escalation of tariff measures could help spur economic activity (and pretty likely decrease upward price pressures).
Disclosure: None.


