
Business Cycle Indicators And Inflation, End-May 2021
April personal income and consumption figures were released today, along with real manufacturing and trade industry sales. Here’s a depiction of these figures in the context of key macro indicators followed by the NBER Business Cycle Dating Committee:
(Click on image to enlarge)
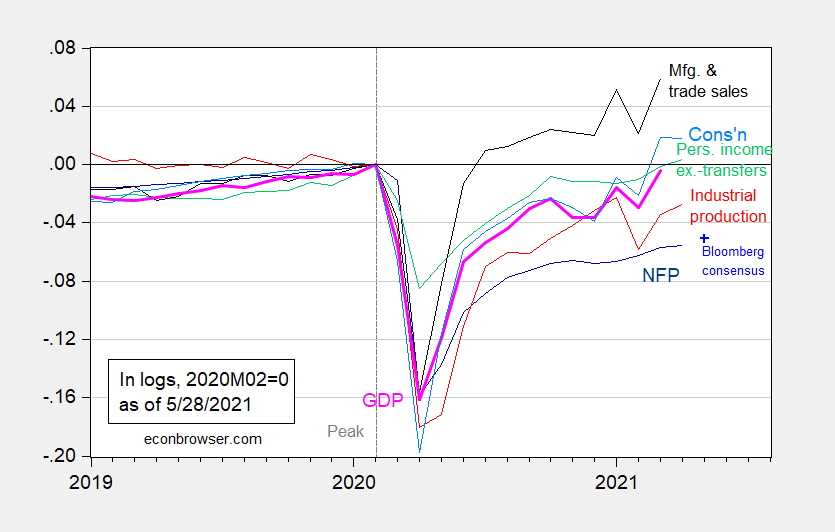
Figure 1: Nonfarm payroll employment from April release (dark blue), Bloomberg consensus as of 5/28 for May nonfarm payroll employment (light blue +), industrial production (red), personal income excluding transfers in Ch.2012$ (green), manufacturing and trade sales in Ch.2012$ (black), consumption in Ch.20122$ (light blue), and monthly GDP in Ch.2012$ (pink), all log normalized to 2020M02=0. Source: BLS, Federal Reserve, BEA, via FRED, IHS Markit (nee Macroeconomic Advisers) (5/3/2021 release), NBER, and author’s calculations.
The personal consumption expenditure deflator figures were also released, providing another measure of inflation.
(Click on image to enlarge)
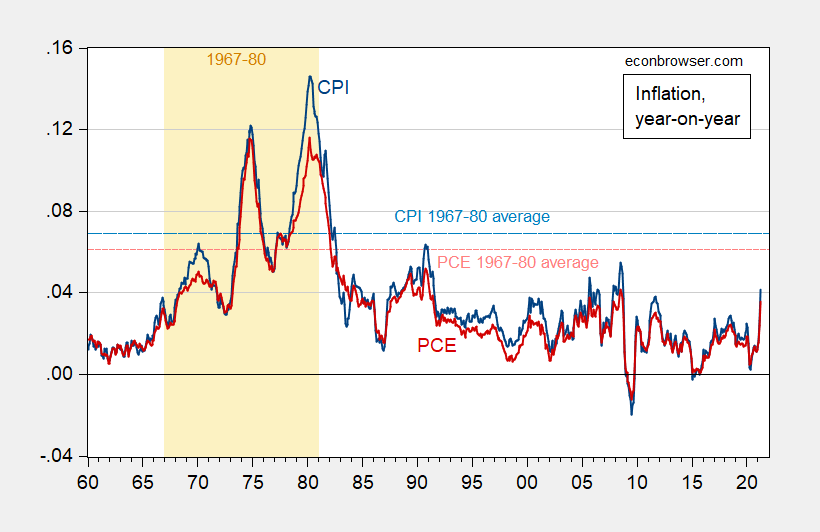
Figure 2: CPI inflation (blue), personal consumption expenditure (PCE) deflator inflation (red), both year-on-year. Dashed light blue (pink) line is average CPI (PCE) inflation 1967-1980, corresponding to orange shaded period. Source: BLS and BEA via FRED, and author’s calculations.
CEA twitter thread on income/consumption release.
Addendum:
Here is Figure 2, displaying 14 month annualized inflation.
(Click on image to enlarge)
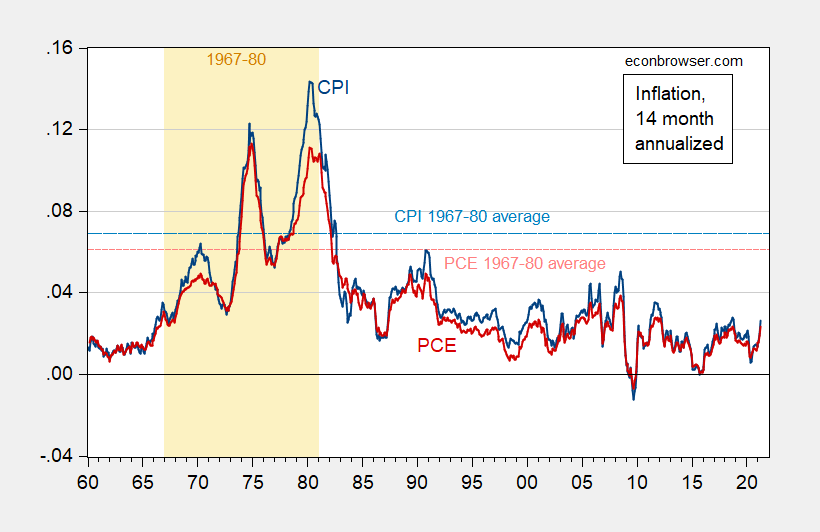
Figure 3: CPI inflation (blue), personal consumption expenditure (PCE) deflator inflation (red), both 14 month annualized. Dashed light blue (pink) line is average CPI (PCE) inflation 1967-1980, corresponding to orange shaded period. Source: BLS and BEA via FRED, and author’s calculations.
Disclosure: None.


