
BTC/USD – Long Term Price Action Analysis
(Click on image to enlarge)
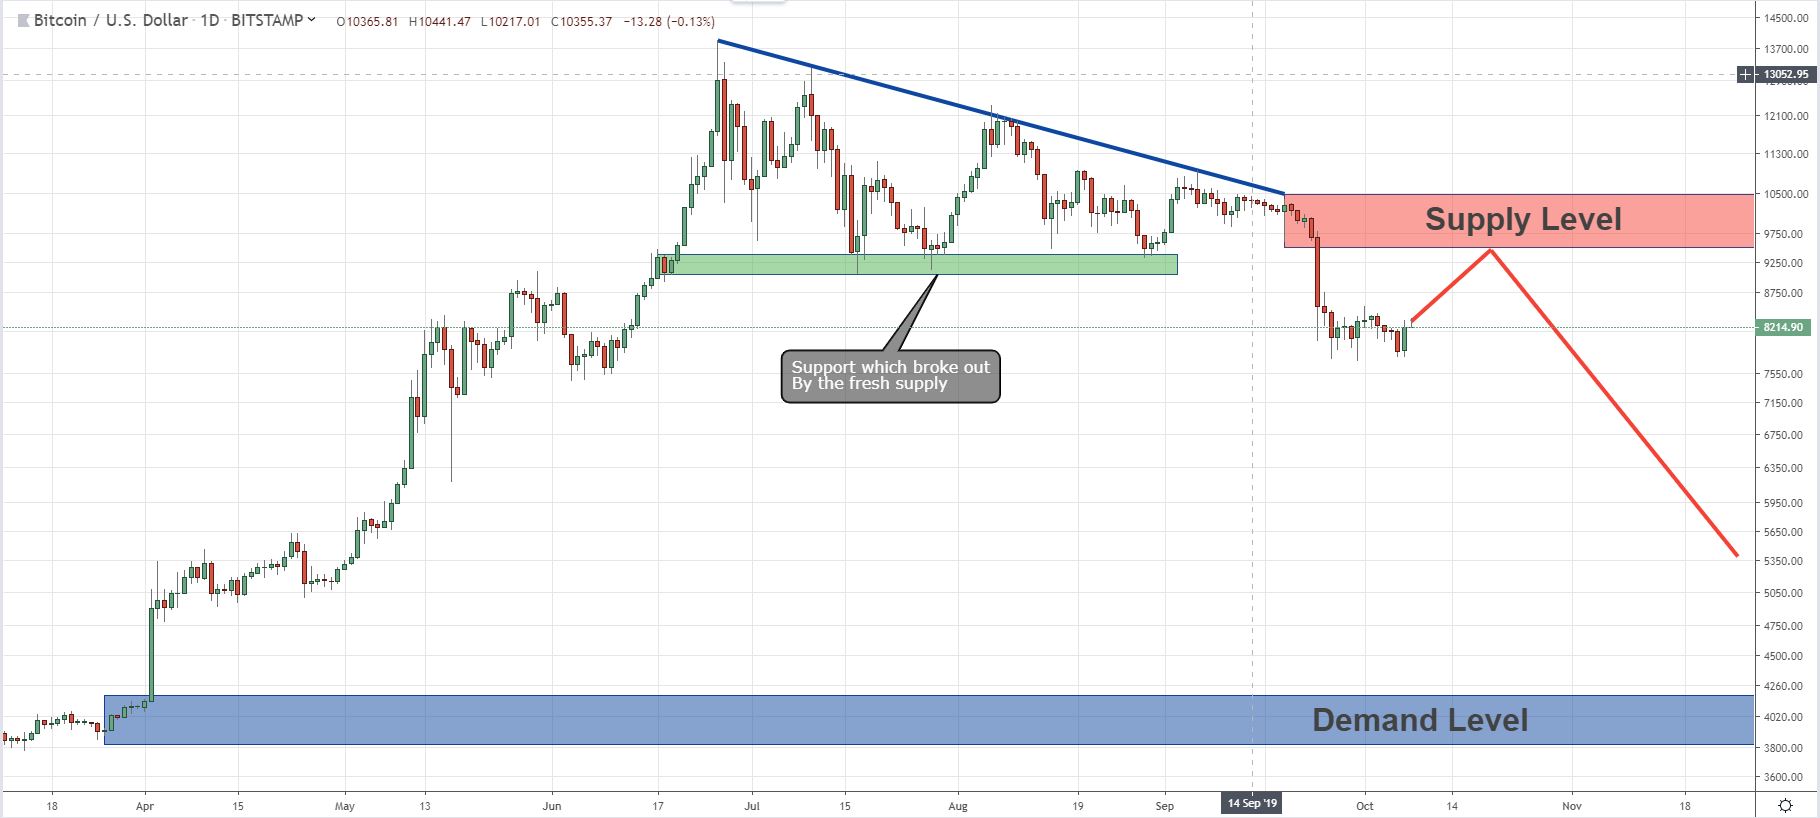
On the D1 time frame chart, BTC/USD price performed a Descending triangle pattern.
The Descending triangle pattern represents a situation where the buyers cannot push the price to a new high.
The price creates a lower and lower highest while the sellers struggling to push the price lower and creates the support.
Usually, this fight between sellers and buyers ended with a breakout of the support.
Two weeks ago, it happens while a fresh supply broke out the support of the descending triangle pattern.
Breaking out the support indicates the BTC/USD price is bearish and tends to reach the next fresh demand which is 4200.00 zones.
For now, I’ll wait to see if the price will retest the supply above.
If that happens, I’ll sell BTC/USD at this supply which broke out the support before.
Since the next fresh demand on the chart is in 4200.00 zones, it will be the target for this long term sell position.
This demand is not only the target but also a great fresh demand for buy position.


