
Break It Down And It Comes Together
At Midas Touch Consulting, we nurse the market through its evolution in time. We measure the pulse and temperature in intervals. Break the market down into segments and evaluate a possible future scenario. We do this from a larger time frame perspective with inter-market relationships and fundamentals asking “hows”, “when” and “whys”. We also follow price probabilities and if our anticipated scenarios match at a future point in time with market behavior we act. Our main tools are a bi-monthly analysis, a weekly chartbook, the daily call, an intraday market snapshot followed by real-time entries and exits. We break it down and it comes together.
Here a recent example of how this works in sequence:
BTC-USDT, Hourly Chart, Sequence, break it down and it comes together:
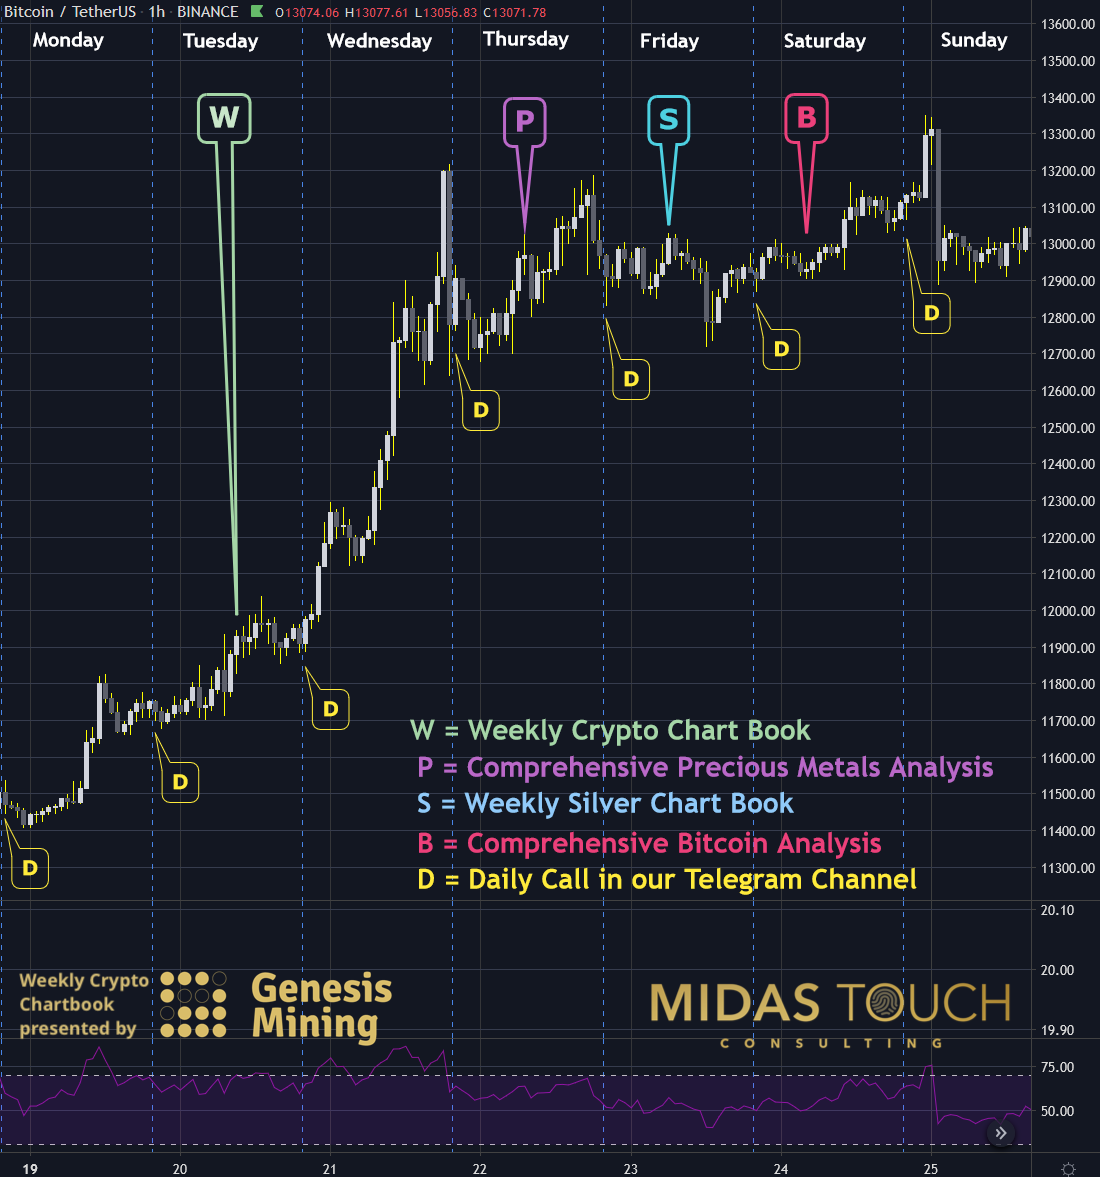
BTC-USDT, hourly chart as of October 25th, 2020
If you look at the hourly chart above, you will find the general structure of our sequencing:
- P (comprehensive precious metals analysis): 10-22-2020 and
- B (comprehensive Bitcoin analysis): 10-24-2020 represents the mid to long-term roadmap for possible trend direction with in-depth analysis for the “hows”, “when” and “whys”. They show the macrostructure and inter-market relationships.
- W (weekly crypto chartbook): 10-20-2020 and
- S (weekly silver chartbook): 10-23-2020 start to zoom into possible trend setups for the mid and short-term player. They try to set the near-term weekly view of where prices might head. Inter-market relationships point out high probability entry and exit points.
- D (The daily call posted daily in our free telegram channel): is a heads up for the daily trading session on how we see the probabilities to pan out over the next 24 hours.
BTC-USDT, Hourly Chart, Zooming In:
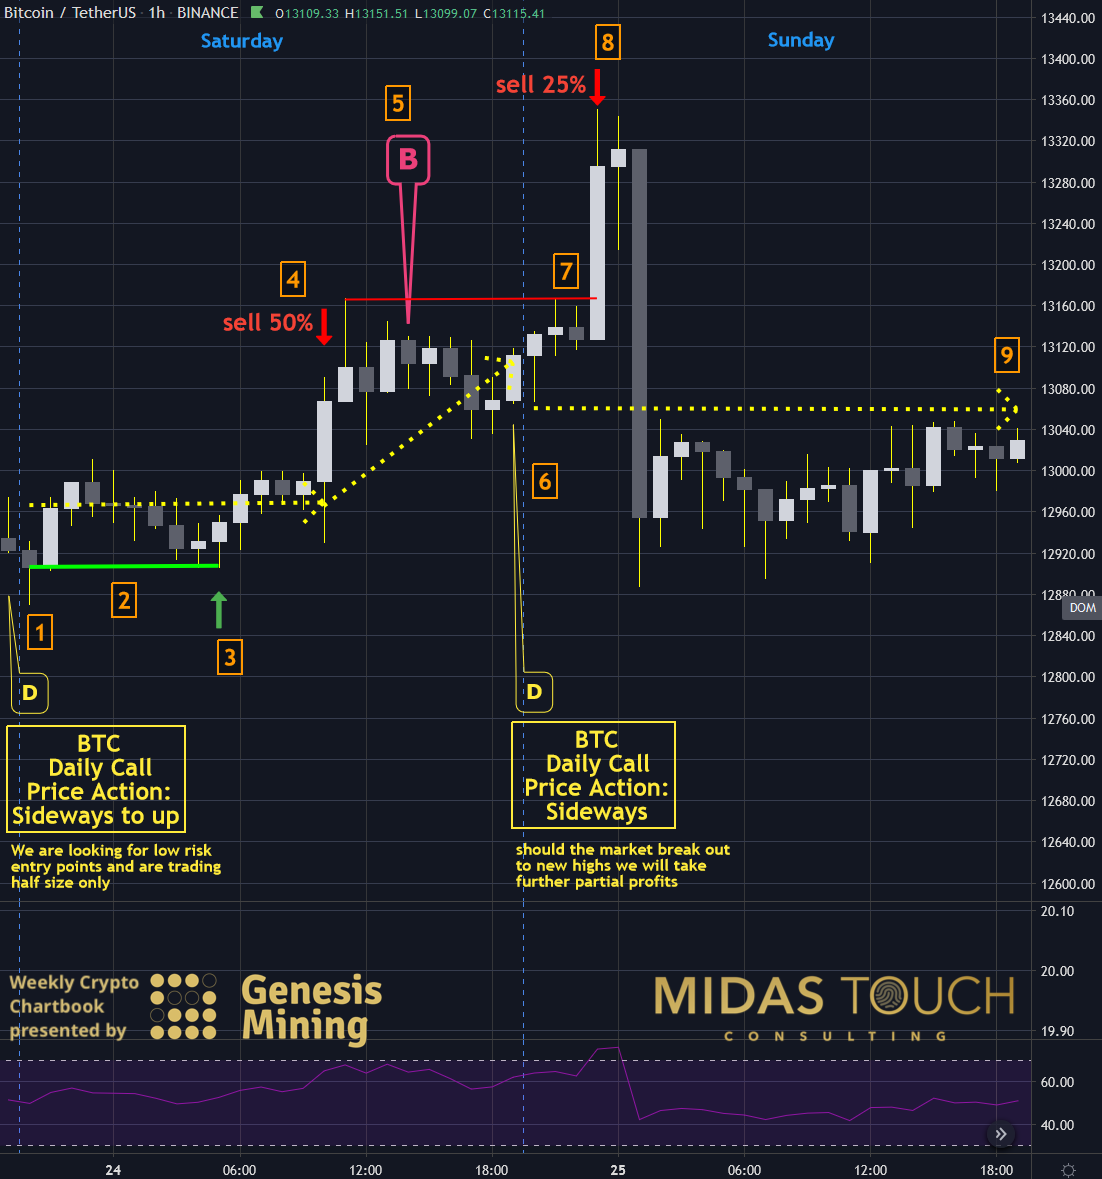
BTC-USDT, hourly chart as of October 25th, 2020 b
The main goal of the daily call is to focus the short-term trader/investor on what not to do. In our case, that was “not to short” the market. This helps to not constantly looking for entries and imagining some, where truly there aren’t any. Now zoomed in a bit, at the end of last week, on the 60-minute chart above you can see we:
- 1st.: placed a “daily call” in our free telegram channel to look for a low-risk long entry on half position size.
- 2nd.: over the next ten hours, such an entry in the form of a wide double bottom matured (green horizontal line) and.
- 3rd.: we had a long entry (green up arrow).
- 4th.: we took half of our position off to reduce risk (see our quad exit strategy).
- 5th.: we zoomed out of the micro view to be reminded of the larger picture releasing the comprehensive Bitcoin Analysis (B).
- 6th.: Sunday’s daily call was released, advising that a market breakout to new highs would most likely to be false and as such a time to take more profits.
- 7th.: four hours later this prediction came true.
- 8th.: We posted another exit in real-time right near the, later to be found out, highs of the day.
- 9th.: like the prior day the daily calls’ main prediction of the day’s condition came true which avoided wrong counter-trend entries and as such reducing losing trades (yellow dotted line).
BTC-USDT, Daily Chart, Right now:
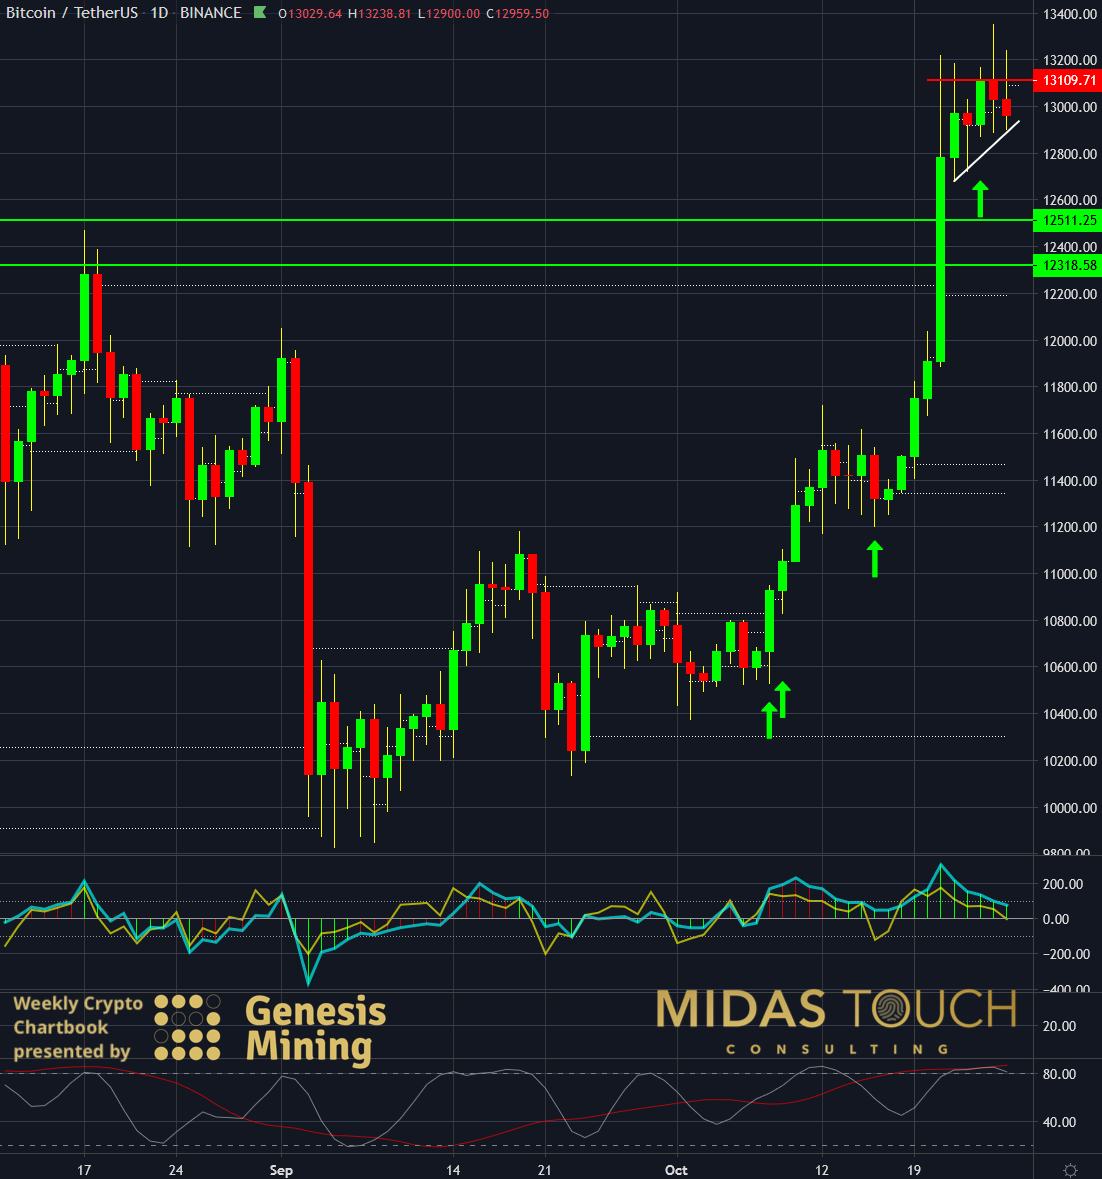
BTC-USDT, daily chart as of October 26th, 2020
Zooming out to the daily time frame, it shows why we only trading half-size and are making rare, conservative plays. In this over-bought environment, low-risk entries are rare. This is rather an exit zone versus aggressive long entry market participation. We are looking for reentries near the horizontal green line price levels.
It is this sequencing process of breaking complex processes down into small manageable junks of analysis from a top-down perspective that allows us to stay disciplined to not trade riskier plays even when the trend seems to provide an edge. We focus on the total picture. It comes together by seeing the market through the prismatic view. Perceiving the market in these smaller junks of stacked probability truths.
Break it down and it comes together
The common principle refers to things losing their whole once dissected and analyzed and broken into pieces. Not so in the market.
It isn’t the first time that market behavior is counterintuitive and opposite to typical rules. With variability that high this multidimensional chess requires time segment by time segment analysis and a macro and micro view at the same time. By sequencing analysis time events and measuring probabilities anticipatory, multiple goals are achieved. Segmenting takes away the overwhelm of data. It only allows anticipatory planned probabilities matching the market, hence limits data density. This allows for more conducive data reduced reactionary execution. It also avoids some of the emotional triggers that high data density in higher volume nodes and wider range and volatility typically overwhelm the novice trader.


