
Yields Soar, Sending 30Y Real Rates Positive Amid Overheating Panic: What Happens Next
Earlier today we pointed out that after being frozen for almost a year...
(Click on image to enlarge)
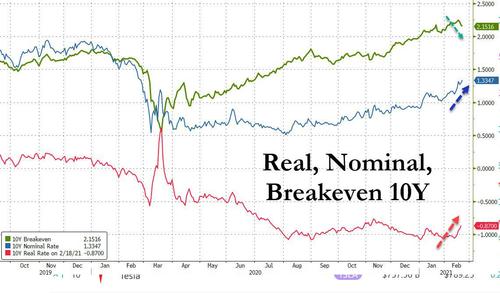
... real yields finally surged, and nowhere was this more visible than 30Y real rates (i.e., TIPS), which just rose above 0%...
(Click on image to enlarge)
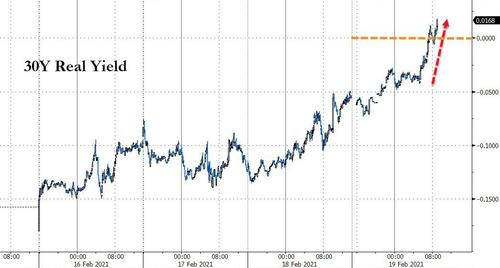
... for the first time since June as 10Y real yields are suddenly exploding higher as breakevens slump.
(Click on image to enlarge)
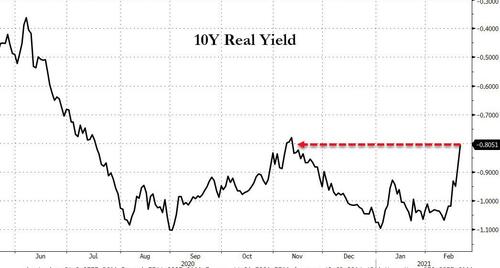
And now that Real Rates have joined Breakevens (which have moved sharply higher on the spike in commodity prices and especially oil) in surging fast, concerns about a real (no pun intended) VaR shock are also rising.
As a reminder, and as we discussed recently when it comes to VaR shocks - destabilizing, multiple-sigma events which lead to forced deleveraging among institutional investors who are forced to puke their "safe" assets - even more important than how high rates rise is how fast they do so. This is why a recent Goldman note "If Real Yields Rise More Quickly" is suddenly very appropriate. This is what Goldman said:
Real yields near all-time lows, but risks in focus. Investors have become more focused on the potential for and risks of higher US real rates after the shift to unified Democratic control. Our forecasts are for modest increases in 10-year real yields through 2021, but it is worth considering the impact of a faster move.
Looking back and looking forward at potential drivers and impacts of rapidly rising real yields. We examine three episodes of rapid increases in real rates over the last 15 years and look at what drove asset performance over those periods. Then, we illustrate the estimated sensitivity of key assets to shifts in both real rates and the growth outlook and predict asset responses to scenarios under which real rates might rise sharply.
Responses to perceived shifts in monetary or fiscal policy alongside improving growth are the most likely catalysts for any larger real rate move today. Past episodes of real rate spikes have generally followed a period of significant real rate decline; have come against a backdrop of improving growth views; and have generally featured either a perceived shift in central bank policy or in fiscal policy.
For markets, it matters whether higher real rates are “growth” or “policy” driven. Asset market responses to higher real rates depend significantly on the source of the rates move. If improving growth expectations remain firm, the impact on US equities and credit is likely to be limited, even if the market experiences temporary anxiety. Shifts in real rates driven by expectations of more hawkish monetary policy are apt to be more damaging.
Broader market backdrop matters for asset responses too. The 2013 taper tantrum coincided with a sustained downshift inChinese growth. The sharp pressure on EM assets and commodity currencies over that period owes as much to that dynamic as to the impact of higher US real rates. By contrast, when real rates rose sharply in 2015 and especially in late 2016, markets were upgrading their views of China-linked assets.
Sensitivities to growth and real rates have shifted post-corona crisis. The response of US equity sectors and indices to growth and real rate shifts has been different in the coronacrisis than in the period before. While banks have remained consistent outperformers, the underperformance of tech-related stocks and other “high-duration” stocks during periods of sharply rising growth and real rate expectations is a recent phenomenon. While some of this shift may stem from the rotations specific to the post-corona reopening process, we expect the vulnerability of the Nasdaq/tech complex to higher real rates to persist for now.
Protection against large real rate increases available in rates and beyond. The simplest protection against higher rates comes in Treasury markets themselves, but tilting portfolios towards less rate-sensitive areas may also help. Both past episodes and our scenario analysis suggest that gold and $/JPY may also offer good optionality for scenarios in which real rates rise more quickly.
For the visual learners, this exhibit below shows asset patterns over the three core episodes of rapid real rate increases, illustrating that the growth, policy, and market backdrops matter.
(Click on image to enlarge)
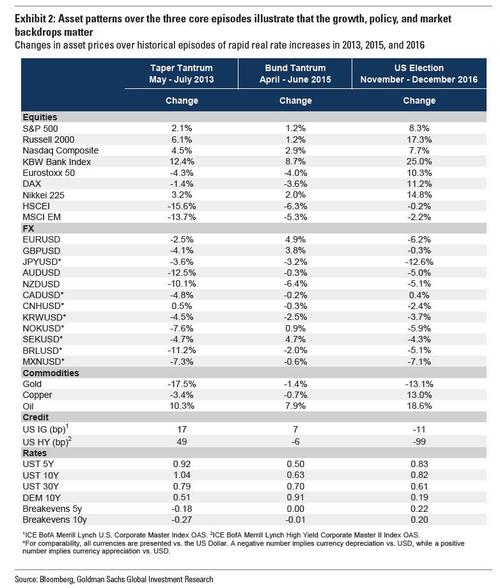
Some observations:
- US real and nominal rates rose all along the curve in each episode, so perceptions of Fed policy—not just of the neutral rate and term premium— shifted. US yields rose relative to Europe in the two US-led episodes (2013 and 2016), while Bund yields rose substantially more in 2015. US breakeven inflation fell during the taper tantrum, when more hawkish US monetary policy played the strongest role but rose during the 2016 episode when rising growth expectations dominated.
- US equity indices rose point-to-point in each episode, with the largest rise coming in the most cyclically-driven of the three (2016). The Nasdaq, a focus of recent market fear of higher rates given the perceived risk to long-duration stocks, was not a consistent underperformer in these earlier episodes, with yield proxies like utilities suffering more consistently. Banks were a consistent outperformer, however. Credit spreads widened during the taper tantrum but narrowed in the more cyclically-driven 2016 episode.
- EM equities (in USD terms) generally declined, while Japanese equities were nconsistently positive (volatility in Japanese equities and the JPY in 2013 was amplified by assessments of BOJ policy which played a major role in driving local assets over that period). But the very large declines in EM assets during the taper tantrum episode (and in commodity currencies) appear to have been reflective of the combination of a China growth slowdown alongside rising US real rates. Declines were more modest in other episodes.
- The US Dollar was generally stronger in all three episodes. Amongst the major ncurrencies, the JPY weakened most consistently. With the 2015 episode reflecting more hawkish perceptions of the ECB and Bund yields rising relative to Treasury yields, EUR/$ and other European currencies generally appreciated over that period.
- Gold moved consistently lower across the three episodes, while oil moved nconsistently higher. For gold, the declines in 2013 and 2016 were large by historic standards.
Looking at just the infamous 2013 blowout in real rates, the three sub-periods of the taper tantrum are again instructive.
(Click on image to enlarge)
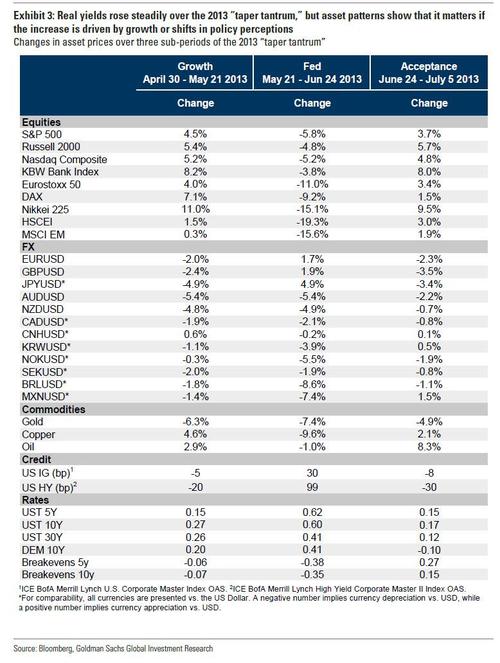
As Goldman writes, US equity indices rose during the “Growth” phase, fell during the “Fed” phase (the SPX saw a roughly 6pctdecline), and rose again in the “Acceptance” phase. The pattern in US credit and DM equities was similar. The USD appreciated across all three periods against many currencies, but during the “Fed” phase, the Dollar depreciated against other reserve currencies (EUR, JPY, GBP). Gold consistently declined across all periods while US bank stocks outperformed across all three.
* * *
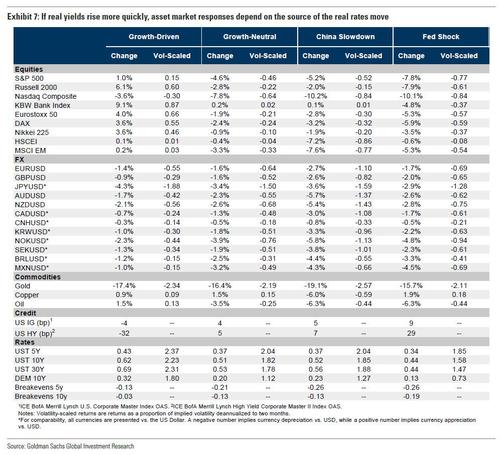
The above observations allowed Goldman to use these sensitivities to construct predictions for moves in key assets under various scenarios in which real rates might rise. These provide an alternative set of templates to the three historical episodes. The bank compares the predicted shifts to implied volatility in options markets to get a sense of where those moves are larger relative to current options pricing. For all scenarios, Goldman assumes an increase in 10-year US real yields of 70bp. This is a much larger shift than in the bank's central forecasts but similar to the experience of the 2015 and 2016 episodes.
1. Growth-driven. Goldman considers a case where the growth factor rises by around 70bp, which is close to assuming that the bank's bullish GS US growth forecast is fully reflected by the market.
2. Growth-neutral. The bank considers a case where US growth expectations are flat, to 2.highlight the impact of a rise in real yields alone.
3. Fed shock. Next, the bank considers a case where US growth expectations fall by 40bp. This is similar to the magnitude of the declines in the second stage of the 2013 “taper tantrum” and is consistent with the market pricing in a more hawkish Fed outcome.
4. China slowdown. Finally, Goldman considers a case where China growth expectations fall alongside a real rate increase. The forecasts do not envisage this kind of slowing in China growth, but it is useful to illustrate how that mix of risks would impact asset returns, as it did in 2013. We are more likely to see periods of sequential slowing in Chinese growth than in other major economies, which may lead the market to worry about this kind of risk.
The predicted outcomes largely reinforce the lessons from historical episodes.
- Breakeven inflation is assumed to fall materially in all scenarios except the growth-driven one, so the rise in nominal yields is generally less than in real yields. 5-year yields are predicted to rise less than 10-year yields. Because these are all assumed to be shocks led by US yields, US yields rise relative to European yields. Goldman thinks that is the most likely risk case, but an ECB-induced yield spike would likely reverse that pattern, as it did in 2015
- The S&P 500 is predicted to remain resilient in the “growth-driven” case, but decline in the others, particularly in the “Fed shock” scenario, where it is estimated to fall by nearly 8%. The Nasdaq is predicted to decline in all cases, while the Russell 2000 is generally the outperformer, though this would shift if US growth expectations were dented enough. US banks would be expected to outperform in all scenarios, and particularly in the “growth-driven” scenario. Mirroring the equity patterns, US credit is predicted to be tighter in the “growth-driven” case and only meaningfully wider in the “Fed shock” case.
- International equity indices generally reflect a similar pattern of resilience to a "growth-driven” case, but pressure in the face of a “Fed shock.” EM equities are generally expected to underperform, but that underperformance is only substantial in the case where China growth expectations also slow. Japan is generally the most resilient of the major non-US indices. The USD is generally predicted to strengthen, with the JPY displaying the most consistent weakness of the G10 across scenarios. In the “growth-driven” case, the cyclical upgrade generally mitigates the extent of USD strength, except for the JPY where it reinforces it. The mix of a China slowdown and a real rate increase results in the sharpest pressure for many currencies, particularly for EM/Asia and the commodity currencies, and is the strongest bid for the USD in general. Although not captured here, an ECB-driven shock would clearly be likely to see strength in the EUR and European currencies.
- Gold is predicted to decline substantially and consistently across all the various scenarios, reflecting its close relationship with real yields themselves. The estimated impacts vary quite a bit depending on the sample period, but those based on more recent behavior are generally larger (and comparable to the 2013 and 2016 experiences).
- Compared to options volatility, the largest moves—unsurprisingly—are generally in US Treasury yields. But in some cases, the predicted moves in gold are even larger, and the predicted moves in $/JPY are also large relative to what options markets currently imply.
(Click on image to enlarge)
Some final thoughts from Goldman:
Both the historical episodes and the scenario analysis point to similar conclusions for portfolio construction. Even a sharp rise in real rates that is driven by an increase in growth expectations—the version of this risk that is most consistent with our forecasts—is more likely to flatten overall equity returns than to lead to a sustained correction. It would, however, likely lead to pressure on the Nasdaq/tech complex and outperformance in banks and other more cyclical areas within the US market. It could also justify a tilt towards non-US developed market indices (currency-hedged).
Rising real rates driven by worries over more hawkish monetary policy—less likely in our view, but possible through miscommunication—would risk more generalized pressure on equities and credit. EM assets would likely also see more pressure, though it is a mix of rising real rates and slowing China growth that is the highest-risk scenario for this group. The most obvious forms of protection against this kind of monetary policy risk, as we have said before, are likely to come from paying rates or seeking options on higher US yields. Given the tendency for the curve to flatten in these situations, the belly of the US curve may be the most obvious point to position for this outcome. Tilting equity portfolios towards less rate-sensitive areas is another way of “internalizing” this risk.
Positioning for USD strength is another way of protecting against the possibility of this outcome. Unlike rates hedges, long USD positions may also offer protection against other kinds of risk-off events. But in general, we see the FX moves in response to a real rate shock as likely to be quite a bit smaller than for rates themselves on a volatility-adjusted basis.3 And, as the 2015 episode illustrates, a move in real rates that is driven not by the Fed, but by the ECB or another central bank could see the USD depreciate. $/JPY and gold are likely to respond more consistently to rising real rates and offer the most appealing non-rate options for positioning for or hedging this outcome.
Of course, Goldman is just speculating here as nobody knows what will happen this time as never before has the economy needed a $120BN monthly injection to survive. One thing we do know is that nobody is more screwed than the Fed, because if yields are soaring with the taper still two years away...
Yields going apeshit and taper is still 2 years away.
— zerohedge (@zerohedge) February 19, 2021
Good luck with that
... there is no way the Fed will ever be able to stop injecting unprecedented amount of liquidity into the system. Ever.
Disclaimer: Copyright ©2009-2021 ZeroHedge.com/ABC Media, LTD; All Rights Reserved. Zero Hedge is intended for Mature Audiences. Familiarize yourself with our legal and use policies ...
more


Rising yields will clip assets. Maybe the Fed wants that.