
Where’s The Alpha?
A deep dive into ETFs with the highest alpha coefficients shows small has been huge for equity portfolios; for fixed income, it’s zero duration. But what about the future?
The quest for alpha is often thought of as a search for the holy grail. It’s not. Presumably, there’s only one grail. Comparatively, alpha abounds.
The ETF market includes several funds, in both equity and fixed income, that have cranked out positive coefficients over the past three years. It’s a diverse mix, but worthy of examination to consider the prospects for alpha persistence going forward.
Equity ETFs
To keep things simple, we sorted the equity ETF universe through a Fama-French three-factor lens— the Market minus Risk-Free (Mkt-Rf) premium, the Small minus Large (SmL) return, and the High Book-to-Price minus Low Book-to-Price (HmL) bonus—to find alpha coefficients.
What came through are 185 equity funds that have yielded idiosyncratic returns beyond the model’s market, small-cap and value factors. From these, we’re highlighting the five non-leveraged portfolios with the highest alpha coefficients.
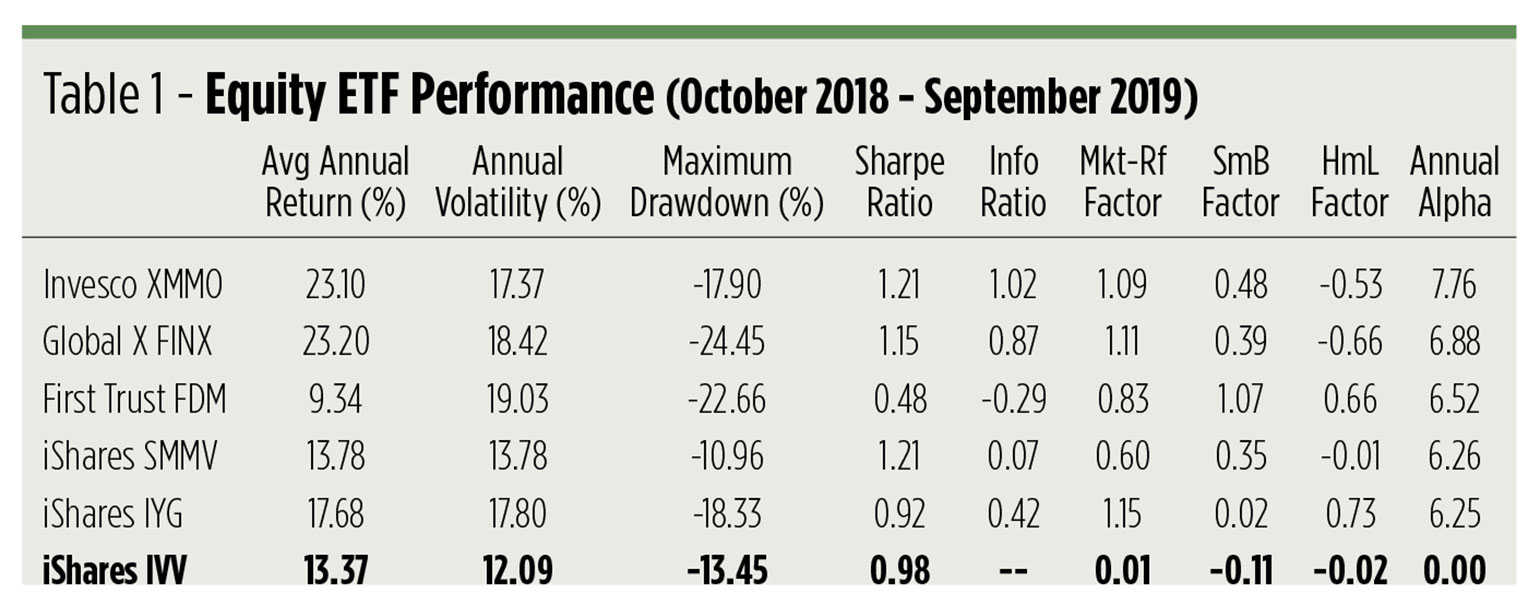
The Invesco S&P Midcap Momentum ETF (XMMO) tracks an index of 80 high-momentum stocks harvested from the S&P Midcap 400. Until June 2019, this fund was a different kind of animal. —The bulk of the fund’s track record can actually be attributed to its former identity as a Russell growth index tracker. Since the fund’s focus has always been the mid-cap tier, its history is still instructive.
Straddling the financials and technology sectors, the Global X FinTech ETF (FINX) tracks a market-cap-weighted index of companies involved in personal finance software, wealth management services, blockchain, and alternative currencies, mobile payments, crowdfunding, enterprise solutions, and marketplace lending.
Small stocks—really small stocks—are tracked by the First Trust Dow Jones Select MicroCap Index Fund (FDM). Focused on the bottom two market-cap deciles, FDM's underlying index screens for financial strength, evidenced by trailing earnings and book value ratios, together with measures of liquidity.
A different angle on small caps is taken by the iShares Edge MSCI Min Vol USA Small-Cap ETF (SMMV). Here, small -caps are built into a portfolio optimized for minimal correlation and volatility.
Lastly, finance—this time, pure finance—makes another appearance through the iShares U.S. Financial Services ETF (IYG). IYG invests in a market-cap-weighted portfolio of stocks representing U.S. investment banks, commercial banks, asset managers, credit card companies and securities exchanges.
Factors
The table’s three Fama-French factors may require some explication. Mkt-RF (the Market minus Risk-Free premium) represents the excess return realized by the domestic stock universe over the one-month Treasury bill rate. SmL (Small minus Large) is the premium of small-cap value, neutral and growth portfolios over their large-cap analogs, and HmL (High minus Low) is the differential return of value stocks, large and small, over growth stocks.
The first thing worth noting is the difference between the benchmark portfolio—the iShares Core S&P 500 ETF (IVV)—and the other funds’ SmL exposures. A positive number signifies a lean toward small-cap stocks; a negative reading connotes large-cap dominance. Clearly, IVV skews toward large stocks. All of the alpha producers tip in the opposite direction. Not surprisingly, the micro-cap FDM portfolio tilts most dramatically to the small side.
It’s more a mixed bag on the value front. On average, the five alpha producers clocked a rather growth 0.19 exposure to the HmL factor. There’s wide dispersion in the exposures, though. The micro-cap and financial portfolios exhibit exceptionally high-value stats, while the volatility-managed small-cap fund and the IVV benchmark are virtually neutral.
So, what’s the takeaway? Just this: Over the past three years, high alpha coefficients have been associated with small-cap exposure. That’s not to say that small-cap exposure is alpha, however. There’s plainly a lot more to this idiosyncrasy business than that.
Fixed income ETFs
When we turn our attention to fixed income portfolios, we’re obliged to consider a different set of factors. The value and size factors used in equity analysis are meaningless, so a two-factor model based on term and credit risk premiums is employed instead. The term factor represents the difference between long-term Treasury bonds and short-term T-bills. Credit risk exposure is gauged against the spread in long-term corporate obligations versus long-term Treasurys.
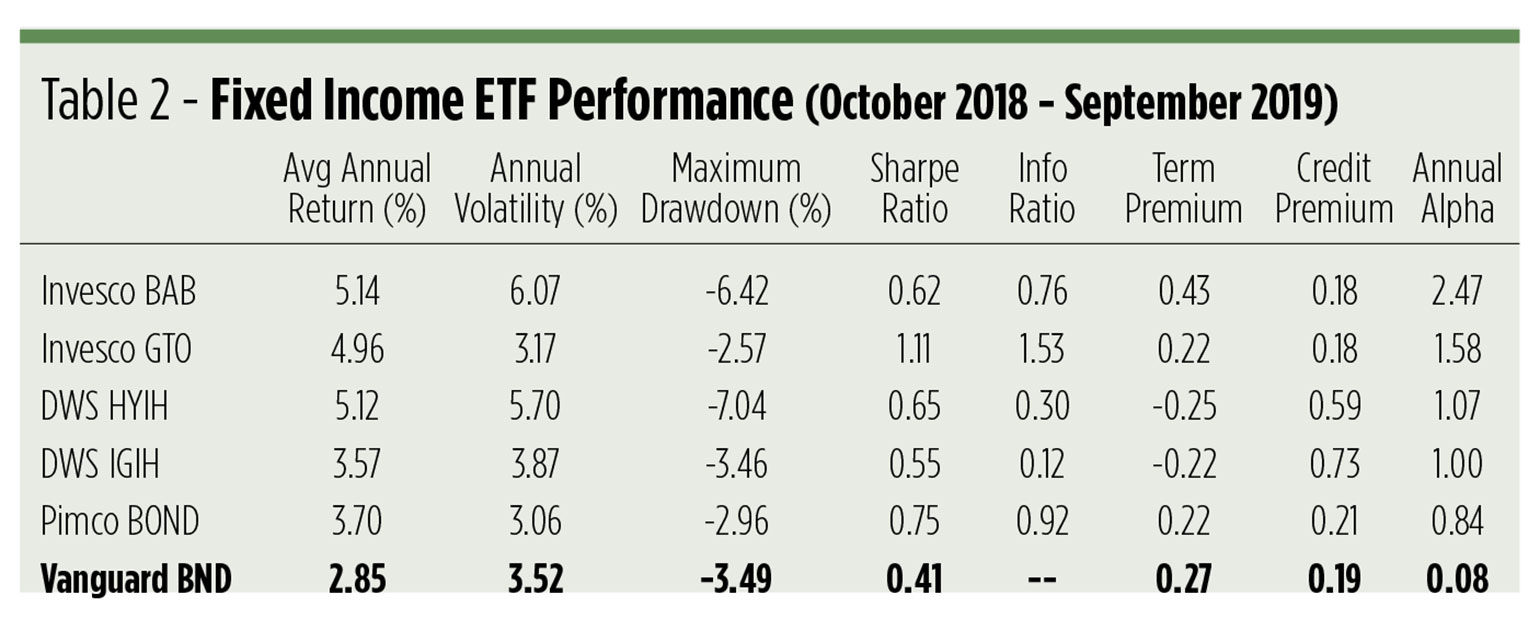
Filtered thus, 39 fixed income ETFs yielded positive alpha over the last three years. Topping the table is the Invesco Taxable Municipal Bond ETF (BAB), which holds a broad array of investment-grade paper issued by entities throughout the United States. With an effective duration of 8.5 years—the longest of any fund in the table—the fund is moderately sensitive to interest rate changes. The average credit quality of BAB’s paper is AA.
The Invesco Total Return Bond ETF (GTO) is a broad-based and unconstrained actively managed portfolio. GTO’s managers are free to invest in sovereign debt, derivatives, other ETFs, bank loans and junk to compete directly with the benchmark Vanguard Total Bond Market Index Fund (BND). Portfolio securities have an average AA+ credit rating with a relatively short duration of 6.2 years.
Two hedged portfolios also made the cut into the top alpha tier. The Xtrackers High Yield Corporate Bond Interest Rate Hedged ETF (HYIH) and the Xtrackers Investment Grade Bond Interest Rate Hedged ETF (IGIH) both match their respective positions in junk and bank-grade paper with short defensive positions in Treasury futures. Hedging results in a net-zero (or thereabouts) duration for the portfolios. The mean credit rating for HYIH’s paper is BB, while the IGIH fund clocks in with an A- average.
Much like GTO, the PIMCO Active Bond ETF (BOND) is an actively managed portfolio offering core fixed income exposure together with the opportunity for investment in high- yield paper, foreign debt and convertible securities. The fund’s duration is 5.3 years at an average credit quality of AA-.
More factors
The top alpha producers on the fixed income side are mainly vanilla portfolios. Two funds, in fact, are direct competitors of the BND index tracker. Both funds have benchmark-like exposure to the credit and term factors, so the returns and alpha they earn are testaments to the portfolio runners’ active management skills.
Most significant is the outsized exposure of the two hedged funds to the term and credit premiums. It’s no wonder. The Treasury futures overlays nullify the underlying portfolios’ duration, driving term exposure into negative territory, while greatly enhancing the tilt toward the credit premium.
Looking back … and forward
If you’re looking for category winners in the tables above, you’re likely to be drawn to the Invesco XMMO and the Invesco GTO funds. XMMO, in addition to being the top alpha producer, earns the best information ratio in the equity table. A fund’s information ratio reflects its payback for undertaking active risk. Here, a lean toward smaller momentum stocks was the ideal broth for cooking up top-notch alpha.
GTO didn’t produce the highest alpha coefficient in the fixed income table; that distinction was attained by the longer-duration BAB fund. GTO, however, generated sharply higher Sharpe and information ratios than BAB. As GTO is a direct competitor to the benchmark BND portfolio, these stats are compelling.
Over the past three years, equity funds with a tilt toward smaller-cap issues and fixed income portfolios bending toward higher quality have been the most successful alpha producers.
But what about the future?
For stock funds, positive exposure to both size and value factors are trending up and likely to be associated with alpha generation going forward. Alpha momentum on the fixed income side belongs to zero duration portfolios, especially those with positive exposure to the term premium.
It can be argued that these trends are manifestations of ever-increasing investor concerns about market uncertainty. It’s a persuasive case. While there’s still a bias toward equity, volatility fears—especially of interest rate volatility—are compelling investors to look at ways to mitigate risk. Not eliminate risk, mind you, but rather, to bolster risk-adjusted returns, i.e., alpha.
Perhaps that’s a recognition that being too cautious may be the greatest risk of all.
Disclosure: None.


