
What Is A Bond’s Yield Curve?

There has been so much talk about the inversion of the yield curves both in the US and in many other countries. In this article, I will explain what the yield curve really communicates and what are the potential implication depending on its slope.
The Basics — What’s A Bond And Its Yield
Governments or corporations around the world finance large portions of their expenses aimed at financing/maintaining projects or refinancing existing debt through the issuance of bonds also referred to as fixed income securities. A bond can be understood as an I.O.U (I Owe You) that includes the details of an agreement and conditions under which to return the principal capital borrowed plus the payment of interest to the lender. The interest rates in a bond transaction can be paid in variable or fixed terms.
Bonds can have different maturities. We call money markets those bonds with high liquidity and maturity or duration below 1 year for financing needs in the very short term. We could call the bonds in a portfolio that consists of average maturity of one year as short-dated fixed income. Then we have the medium-dated bonds with an average maturity of three years. Lastly, the long-dated bonds consist of average maturity six years or longer.
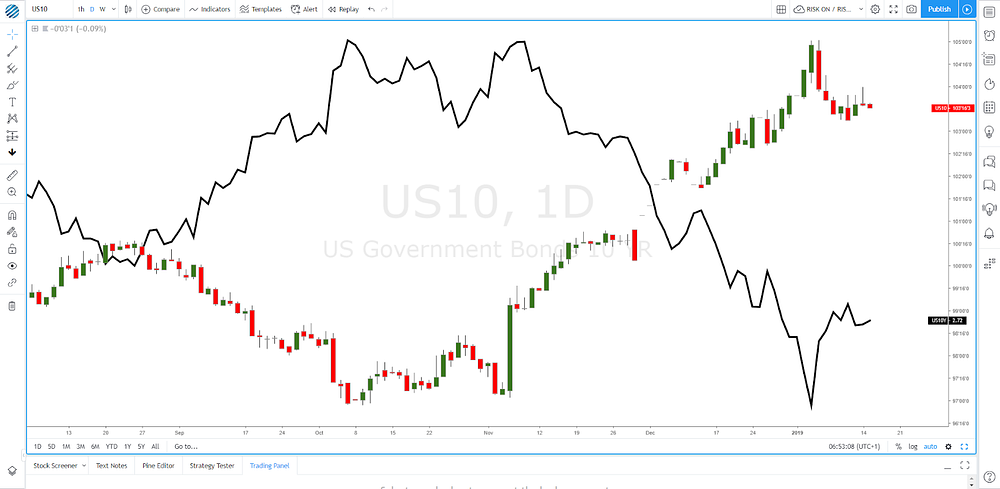
There are two core elements as part of the value of a bond. The first one is the pricing of the bond coupon. Below, I illustrate the 10-yr US government bond (candles), which currently stands at a value of 103 15’ 6. The higher the bond pricing goes, the more demand exists to own the bond, therefore the equilibrium between demand and supply must meet at a higher point. When a bond experiences high demand, the interest rate needed to be paid in exchange for the debt financing needs is lower in inverse proportion to the increase in the bond price. Conversely, if there is scarce demand for the bond, the price will adjust lower and interest rates will go up, as the bond issuer must provide a greater incentive through rates to attract new bondholders.
The most popular forms of bonds maturity by governments include the 2-year, the 5-year and the 10 or 30-year bonds. As an example, let’s imagine that investor A (The European Central Bank) lends capital to bond issuer A (Italy). If we are talking about a fixed rate coupon bond at let’s say 4% and $100 million par value, what this means is that Italy will agree to pay the ECB an equal percentage of its face value of $4 million annually, even as the value of the bond and its interest rate fluctuates based on demand and supply dynamics, in other words, in the perception of value.
Diving Deeper — What’s The Yield Curve
The yield curve is a chart that plots, through a line, the interest rates paid by bonds under the same entity (government, corporates, etc) with different maturities. Yield curves are the best foreteller of future economic conditions. At the end of the day, what yield curves express is the time value of money. The most widely followed yield curves include the 10y — 3 months (Fed’s favorite) or the 10y — 2y maturities.
In theory, a perfect scenario in which an economy is expected to be thriving and expanding over time, a normal yield curve exhibits an upward slope which indicates that the longer the maturity of the bond coupon, the more the investor will demand in interest rates vs short-dated. Find at the bottom what a normal yield curve looks like.
We then have the case of an inverted yield curve, in which short-dated bonds are paying higher interest rates than long-dated bonds. In its own right, that’s an anomaly that communicates the outlook for the economy going forward is decelerating and at times, as it’s happened in a significant number of occasions through history, the inversion of the yield curve tends to be an accurate precursor of recessions in an economy or at the bare minimum, it does suggest lack of potential growth going forward.
Another scenario an economy may find itself facing is the stagnation of the rates along different maturity intervals, which leads to similar yields across the spectrum. This is what we would call a flat yield curve and it communicates indecision and uncertainty about the prospects for the economy. A slight variation of the flat yield curve is what we refer to as humped curve, which occurs when short-term and long-term yields are equal but medium-term yields trade higher relative to the short-term and long-term.
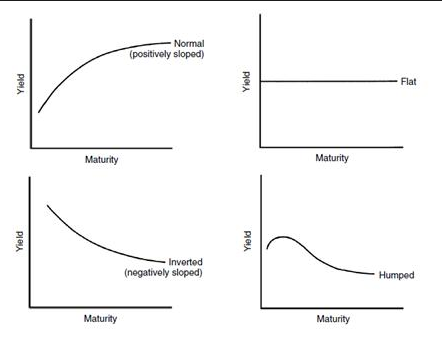
Source: kbsonigara.wordpress.com
Yield Curve Shapes — Steepeners and Flatteners
Let’s take this lesson one level up in sophistication by introducing the various shapes the yield curve can manifest into. First of all, we will make the distinction between what the flattening of the yield curve means vs the steepening of its interest rates.
A bear flattening effect in the yield curve happens as a result of short-dated yields accelerating faster than the long-dated yields. Under these conditions, short and long maturities move towards a convergence that may ultimately lead to an inversion of the yield curve should short-dated bonds pay higher rates than long-dated bonds.
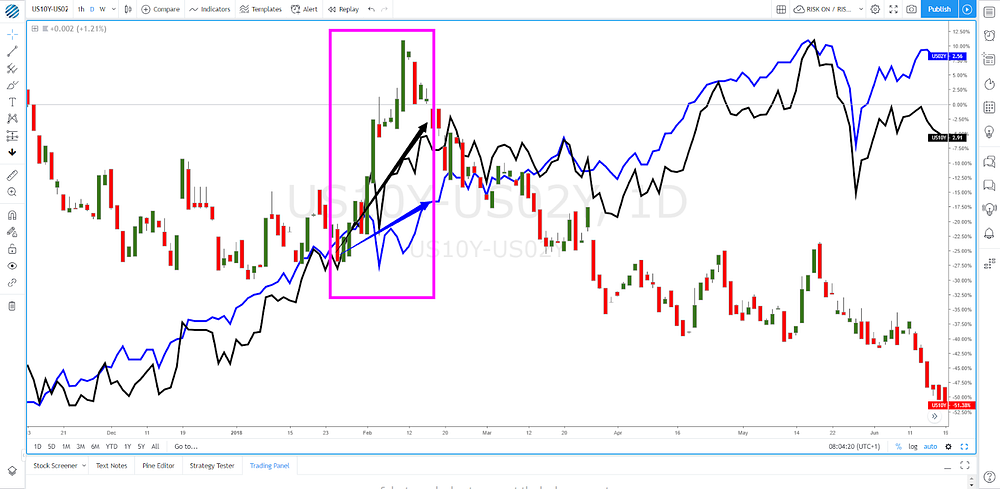
In the example below, one can observe how the yield curve (10y — 2y) is bear flattening due to the effect of a rising 2y yields at a more pronounced rate vs the 10y rate. When this scenario is present, it indicates that the economic cycle is in a stable phase with a relatively expensive domestic currency keeping in check inflationary pressures. However, the fact that the yield flattens, it does indicate that risks are more skewed towards a slowing economy and higher funding costs by the banking industry (LIBOR, etc). It tends to suggest that the Central Bank is getting ahead of itself and that the tightening cycle is likely to terminate as the economy slows down further.
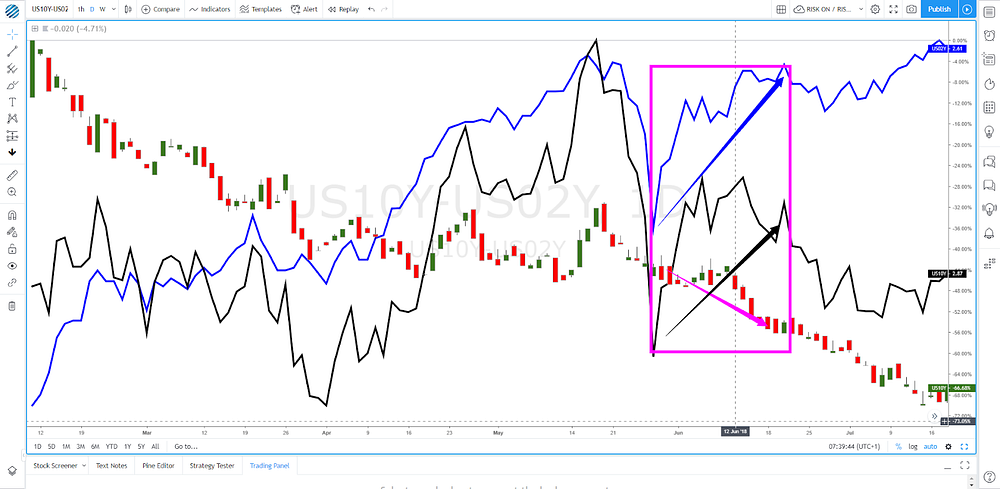
Source: tradingview.com
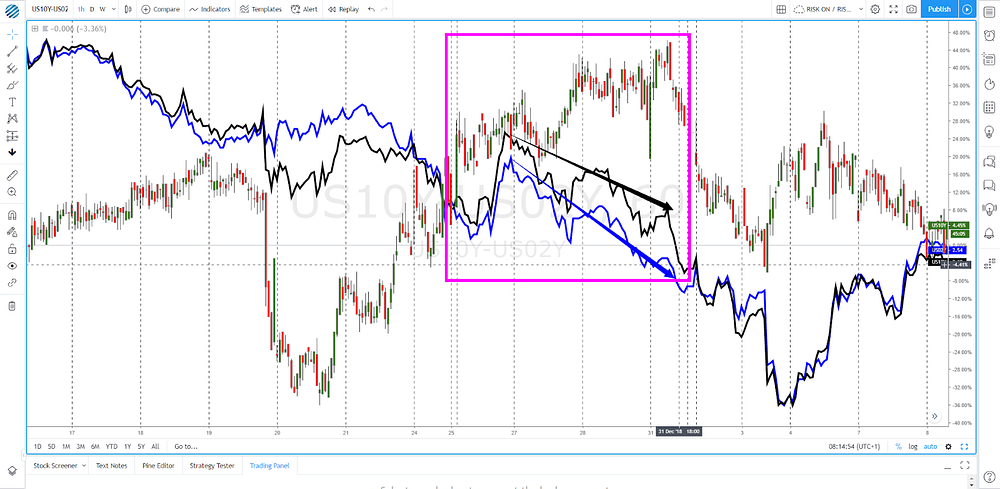
A bull flattener is probably the worst scenario an economy can face and it occurs when the long-dated rates are falling at a faster rate than the short-dated rates. When this happens, it’s often followed by a cut in the benchmark interest rates by the Central Bank in order to calibrate demand and supply for money, which tends to ultimately be a positive sign for equities as there will be less incentive to keep deposits in fixed income (less attractive). Notice, a bull flattening is a consequence of poor economic data. When the yield curve goes through this bull flattening shape, the currency tends to lose value as the anticipation of lower interest rates detracts capital flows from perceiving sufficient value as opposed to other countries with a higher yield spread.
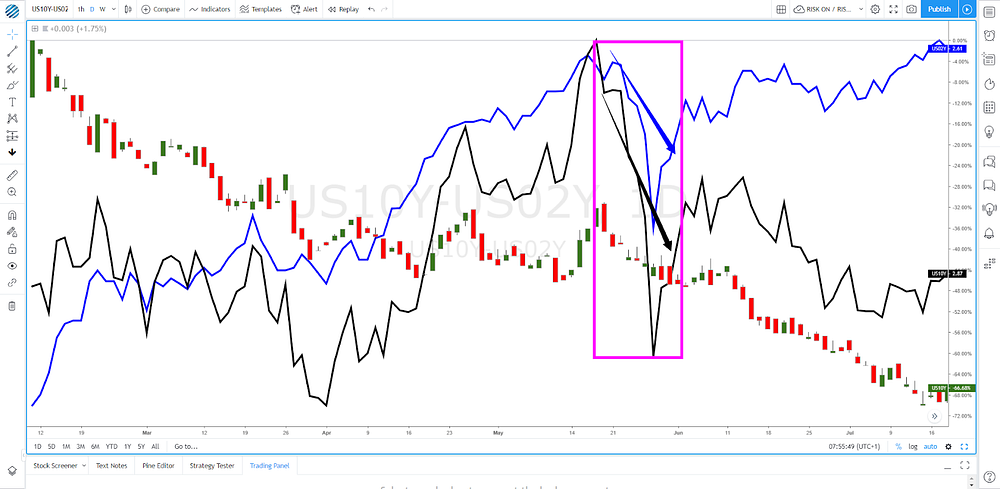
Source: tradingview.com
Let’s keep moving on by introducing what a bear steepener is about. Unlike a flattener, the steepener in a bearish environment for bonds comes as a result of long term interest rates accelerating faster than short term interest rates. It is indicative of an economy where inflation expectations start picking up, hence the market starts to anticipate an increase in the benchmark interest rate by Central Banks to combat inflation. This scenario tends to be bearish for the stock market. Within a bearish steepener environment, the worst scenario is one characterized by little to no growth yet inflation continues elevated. That’s what’s often referred to as “stagflation”.
Source: tradingview.com
Last but not least, we have the bull steepener, which is dominated by short-dated yields falling faster than long-dated yields. The market forms this shape in the yield curve when it predicts that the Central Bank will be lowering its benchmark interest rate, which tends to be a bullish sign for the stock market. Tends to be a far from an ideal environment to buy the domestic currency on anticipation of lower returns in bonds.
Source: tradingview.com
Wrapping Up
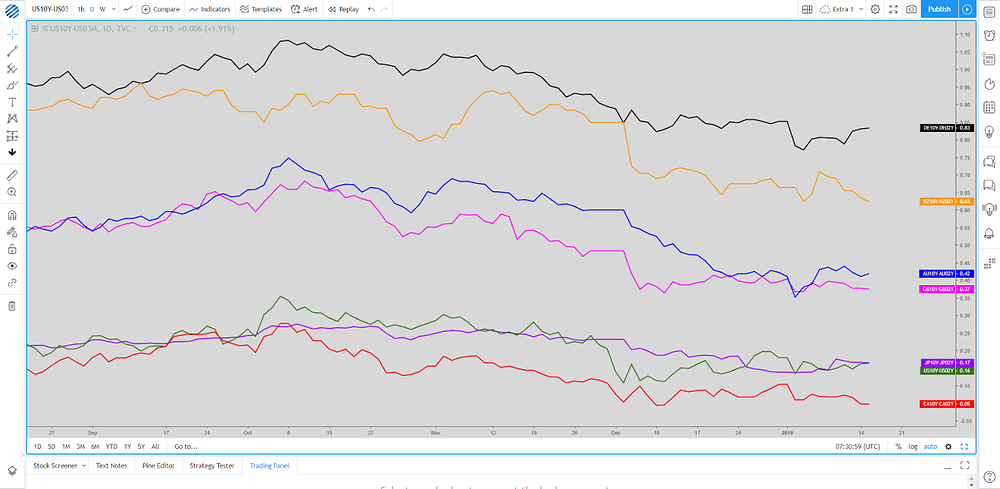
There is enormous complexity when analyzing the state of an economy. We are inundated with various economic indicators with each sector potentially painting a different picture. The right interpretation of a country’s government bond yield curve carries a lot of value to understand the most likely trajectory by the Central Bank and what policy tools could be most adequate to face each different set of conditions. Following the extraordinary experiment of the last 10y via quantitative easing by Central Banks since the global financial crisis, the majority of the global economies are facing bear flattening yield curves at present time, as the chart below illustrates.
After reading this tutorial, you will hopefully better prepared to interpret what the yield curve is all about and why the current global bear fattening curves we are seeing should be a source of concern that communicates investors are far from anticipating thriving days anytime soon.
The Daily Edge is authored by Ivan Delgado, Head of Market Research at Global Prime. The purpose of this content is to provide an assessment of the market conditions. The report takes an in-depth ...
more


Good explanation.