
What A Welcome US Equity Market Pullback! Fading Emotion
Are you as glad to see the pullback in the US equity indices as I am? Yes, rates are going up faster. Inflation has been acknowledged at a higher rate by the Fed. So what?!
It was no secret that rates could not remain near-zero forever. It also is no secret that inflation has been real in the US. If you live in the US, you already know this from your day-to-day life. So, why the big fuss? Did you need someone to tell you?
I know it is painful when long positions move against a trader quickly. Nobody expected the Fed to come out with the language that appeared this week, at least not anybody that I know. I also realize that it may seem logical to sell equities as a result. But, since when does the obviously logical approach win?
So, the overnight Fed Fund rate is scheduled to begin increasing in 2023 (potentially late 2022 if you listened to Bullard on Friday). This news must mean that the Ten-year note yield had to go up, right? Nope. Down she went on Thursday and Friday; after catching a bid on Wednesday of the news.
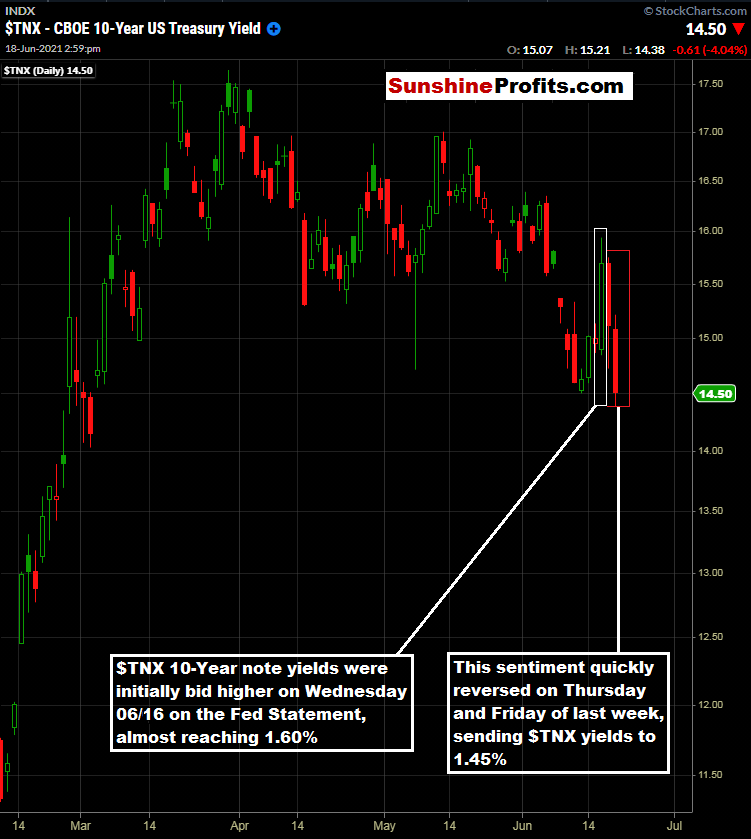
Figure 1 - $TNX Ten-year note treasury yield February 10, 2021 - June 18, 2021, Daily Source stockcharts.com
Perhaps taking a trade like that is just too obvious; too logical. Now, will $TNX increase over time? Most likely it will, but 2023 is a long time from now. We have to wait and see how the new information is digested by the market and go from there.
Can we look to apply similar logic to the S&P 500? For that question, I would like to refer back to the May 12th publication where we discussed $SPX pullbacks to the 50-day simple moving average.
From May 12th:
- $SPX found support around the 50-day moving average on 2 of its last 3 attempts.
- When $SPX broke the 50-day on 1 of the last 3 attempts, it traded below it for 2 sessions.
- When $SPX broke the 50-day in September 2020 & October 2020, it closed below it between 7 - 9 sessions.
Let’s keep in mind that the $SPX traded to the 50-day SMA on May 12th and May 19th, and is now below the 50-day SMA as I write this.
Today, for the SPY ETF traders out there, let’s take a fresh look at recent pullbacks.
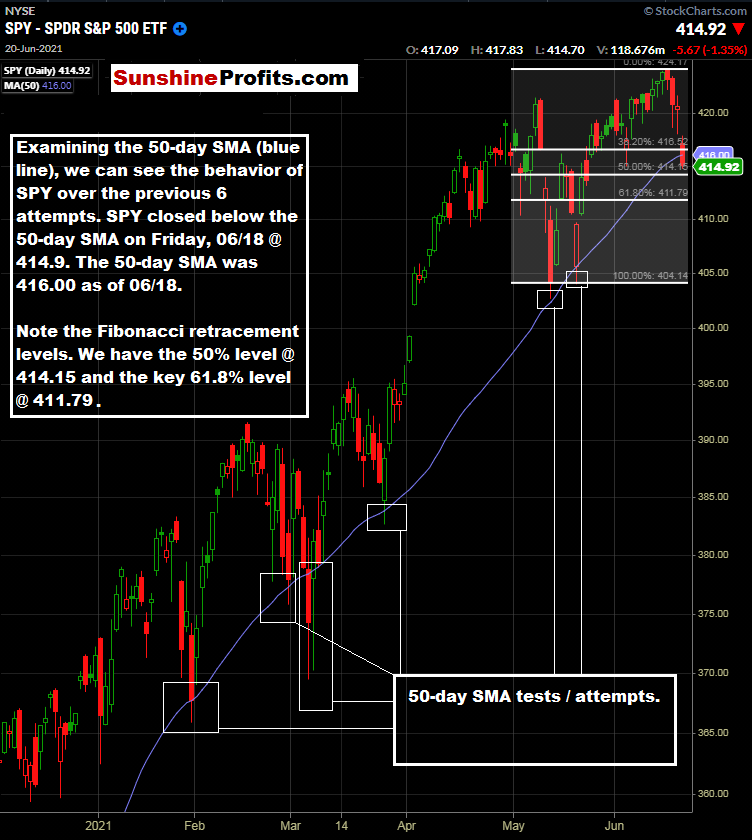
Figure 2 - SPDR S&P 500 ETF December 04, 2020 - June 18, 2021, Daily Candles Source stockcharts.com
Can the previous price action near the 50-day SMA give us any clues about what could happen this time? Well, we have the 50-day SMA, and we also have the 414.15 50% Fibonacci retracement level and the 411.79 key 61.8% retracement level. We have been waiting for such a pullback and I don’t think the recent Fedspeak is any reason to negate consideration of buying pullbacks. I know it seems somewhat illogical; that’s why I like it even more.
Keep in mind that such pullbacks to certain price levels could take place in the overnight futures sessions. In that case, ETF traders may not get the exact price they are looking for if markets reverse to the upside during NY trading hours. At least this gives us some levels to consider.
Why I Welcome this Pullback So Much
If you have been following along and are a premium subscriber, you know that I have been waiting for pullback opportunities across many markets. In fact, out of the eight markets that I am covering, I have been waiting for pullback opportunities in six of them. The current price action and additional downside momentum could give us the opportunities that we have been patiently waiting for in several ETFs.
Disclaimer: This content is for informational and analytical purposes only. All essays, research, and information found above represent analyses and opinions of Rafael Zorabedian, and Sunshine ...
more

