
Weekly Wrap: Market Isn’t Likely To Run Out Of Runway Anytime Soon Home
- Markets continue a slow slog higher as investors seem to agree with Jamie Dimon of J.P Morgan Chase (JPM) that this is “a skirmish and not a trade war.” Time will tell.
- While major US indices are making new all-time highs, the international picture is much weaker this year as are some of the US market internals.
- Economic data for the week was mixed, but we are seeing more evidence of rising costs that will compress margins if those costs can’t be passed on.
This week I’m coming to you from the chilly city of Reykjavik, Iceland where I am meeting with some leading thinkers in the ETF world – sharp folks exchanging ideas is always a great way to spend one’s time.
Monday the Dow Jones Industrial Average lost -0.4% and the S&P 500 dropped -0.6%, ending its 5-day winning streak, as the market got jitters over trade wars — again. The tech-heavy Nasdaq fared the worst, falling -1.4%. This left the FAANG stocks down an average of 15% from their 52-week highs. Monday night the Administration made it official that the tariffs were to go into effect on September 24 with a 10% tax that will rise to 25% by the end of the year/early next year. In response, the 2-year Treasury note yield rose to just shy of 2.8%, the highest level in over 10 years.
Tuesday the geopolitical tit-to-tat continued as China responded to the tariffs with 5-10% duties on $60 billion of US imports. The equity markets were unimpressed with either side of the battle as the Dow closed at its fifth-highest ever and the S&P gained 0.5%. Expectations had been that the US was going for more than 10% to start and China’s response was less dramatic than feared hence the meh response by the US stock market.
Wednesday the markets continued on their upward path, ignoring all the heated words coming out of inside the beltway, with the S&P 500, Dow Jones and NYSE Composite all closing in slightly positive territory while the Nasdaq closed just barely in the red.
Thursday the markets were again in positive territory, so much for the dangers of September. The Dow and the S&P 500 hit new all-time highs during the day.
While September has historically been the most volatile month in the markets and there is certainly enough going on geopolitically and domestically to warrant some nerves, the S&P 500 has been unusually relaxed so far this month. The average absolute daily change for the index during the multiple years that comprise this current bull market has been +/-0.7%. For 2017 that average was more than cut in half, dropping to +/-0.3%, one of the least volatile years ever. While 2018 started out more volatile than last, September so far has averaged a daily move of less than +/-0.24%.
What’s happening?
This lack of volatility isn’t because investors have become a mellowed out crowd, but rather because realized correlations between S&P 500 stocks have fallen significantly since the end of the financial crisis. The lower the correlation, the more the index volatility will decline as moves in one stock cancel the moves in another.
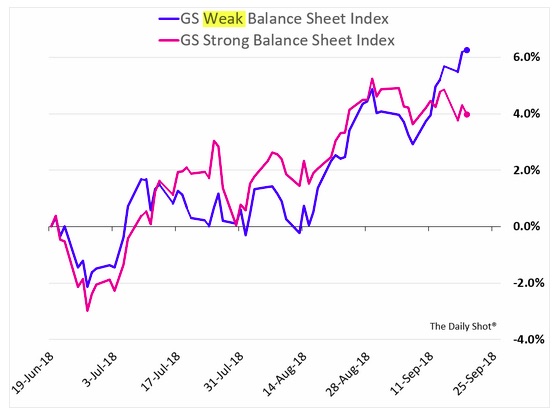
What we have seen is greater risk appetite as those companies that have higher leverage ratios have been outperforming. (h/t The WSJ Daily Shot)
I’ll also point out that this extended period of uber-low interest rates has led to companies issuing a record amount of debt with corporate debt as a percent of GDP near 30-year highs. The search for yield has led to greater demand for lower quality credit as well, resulting in over 50% of investment grade corporate credit rated BBB, rising from $700 billion to $3 trillion over the past eight years. The median debt-to-EBITDA ratio has increased from 2.1x to 3.2x. An average of $2 trillion of corporate debt will mature every year over the next five – at materially higher rates.
This week’s US Treasury international capital flow data revealed that over the past three months foreign investors have purchased a new $245 billion in US short-term debt, a historical record. On the other hand, the biggest decline has been selling a net $68 billion in US stocks over the past three months while buying a net $19 billion in Corporate Bonds. Thanks to the private purchases of short-term debt, agency debt and corporate bonds, capital inflows remain strong with the private net purchases of US financial assets at the highest level since 2011 on a rolling 12-month basis. But – the recent weakness in US equity purchases is worth noting.
The 10-year Treasury yield is back up above 3% again and the yield curve has steepened recently, with the spread between the 10-year and 2-year back up to 24 basis points from a low of 18 basis points in late August. Taking a step back, the 2-year Treasury rate has doubled over the past year from 1.4% to 2.8%, a magnitude of change that has occurred just three times in the past. Whenever this has happened before, it turned the investing landscape upside down, such as in 1993-94 (rising from under 4% to over 7.5%) which preceded the Mexican Peso Crisis, 1998-2000 (rising from less than 4% to nearly 7%) which preceded the Dotcom meltdown, and in 2004-2006 (rising from less than 2% to over 5%) which preceded the Financial Crisis.
Think things aren’t changing?
- Last year global stocks ex-USA (Vanguard FTS All-World ex-US ETF VEU) was up 24.0%, year-to-date it is down 4%.
- Median S&P 500 sector was up 10% last year versus up 2% year-to-date.
- There were 44 countries out of 47 MSCI All World Country Index that closed in the green in 2017. Year-to-date just 15 are in positive territory.
The headlines, major indices, and a domestic focus may make you think that the market dynamics of the last year have continued. They haven’t and the US is increasingly a global outlier.
The Economy
The economic data this week was mixed, with conflicting reports and warnings signs of rising costs.
- NY Fed’s regional manufacturing index (Empire Manufacturing) came in at 19 versus expectations for 23 and the prior read of 25.6 in August. The report revealed that input costs continue to rise, but so far haven’t been passed on to customers which means margin pressures – perhaps a rethink on those earnings estimates!
- The Empire Report’s Measures for New Orders today and in the future along with Current and Future number of Employees indices showed weakening as did the outlook for Shipments, Delivery Time and Unfilled Orders.
- In contrast, Philly Fed headline index rebounded from a 21-month low in August of 11.9 to 22.9 – the big question is which is directionally more correction? Philly or Empire?
- Bank lending has also slowed down. Core loan growth at 4.4% year-over-year, while not meager, is well below the rate for much of the post-crisis period. Commercial and Industrial loans have declined materially from July’s peak of 12% (annualized pace) to 7.7%. Still strong, but the change of vector and velocity are worth noting.
- Housing starts were better than expected at 1.282 million versus estimates for 1.238 million housing permits were weaker at 1.299 million versus 1.310 million expected which means future starts will likely be weaker.
- This week’s jobless claims were lower than expected at 201k versus 210k expected. We have now seen claims at or below 225k for eleven consecutive weeks, the longest streak since 1969.
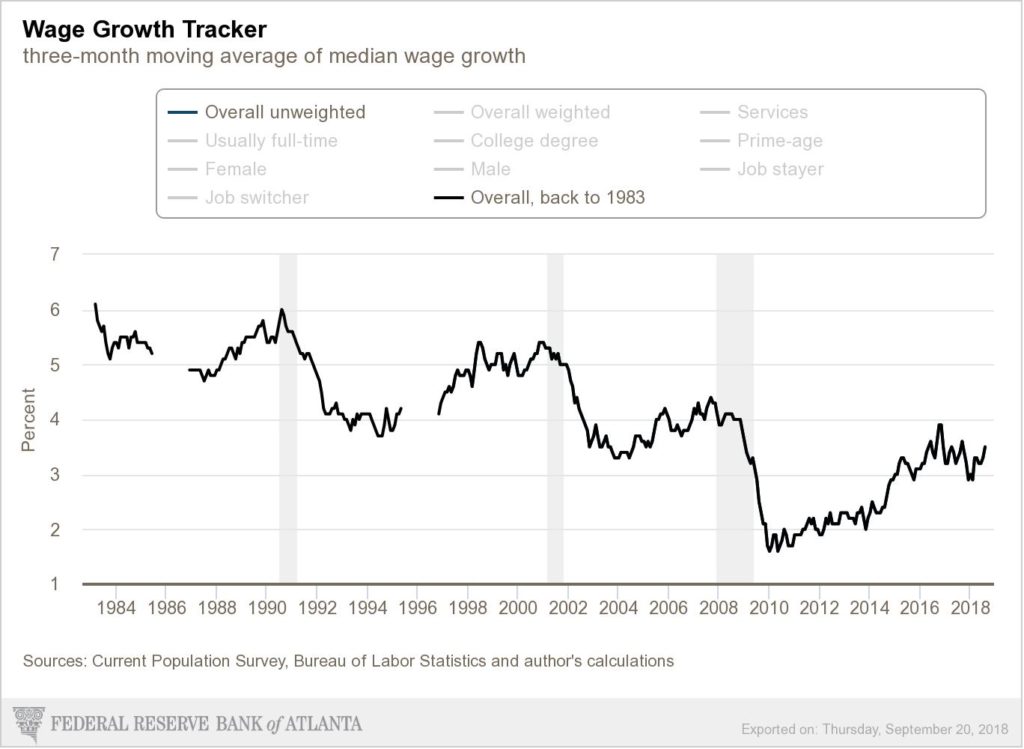
- The Atlanta Fed’s Wage Growth Tracker found that the 3-month moving for the median wage is showing signs of upward pressure, however, growth remains well below historical norms. Rising wages mean pressure on margins.
The Bottom Line for the Week
This is a market that continues to want to go up with plenty of technical and fundamental indicators pointing to continued upward moves, even during this typically tenuous time of year. The economic data, however, is less supportive, but without any real imminent threats, the stock market isn’t likely to run out of runway anytime soon. There are still issues to watch such as the growing spending struggle for the coming Italian government budget, mid-term elections in the US, the US-China trade war and Brexit. Any and all of them could lead to a reversal in the CNN Money Fear & Greed Index, which has been hanging out in Greed territory for the last month.
Next week we’ll get the Chicago Fed national activity index, Case-Shiller home price index, consumer confidence, durable goods orders, core capex orders and most importantly, next Friday we review the latest on personal income and consumer consumption. Interspersed among that data flow we have the Fed’s next FOMC meeting at which it is widely expected to boost interest rates. With that known, the greater focus will likely be on the Fed’s updated economic projections, its latest view on inflation and any comments it makes on the speed of the economy and the current trade war. Should be one of the more fun FOMC press conferences, especially if Fed Chair Powell actually answers a question.
Disclosure: None.


