
The uncertainty about where neutral is today creates a challenge for policymakers.
Neel Kashkari
Minneapolis Federal Reserve President
Last week was a volatile one for markets with big swings in stocks and bonds in a holiday shortened week. The economic data didn’t appear to be sufficiently out of the expected range to justify big moves, but we got them anyway. And I think the reason is the one cited by Neel Kashkari in the quote above – the Fed doesn’t know what to do and they tell us so every day because they can’t seem to shut up. I don’t mean to imply that they are somehow out of the mainstream on this as I don’t think anyone really knows how monetary policy should evolve right now. There is tremendous uncertainty about the course of this new post-COVID economy because it has defied prediction almost since the first sneeze back in early 2020. And that isn’t even considering the uncertainty around the election this fall, which got just a little more confused last week.
I pointed out last week that there really isn’t anything in the market indicators we watch that point to an imminent recession and that didn’t change in one week. I also pointed out some areas of concern but this week I want to take a little deeper dive into some of the details. First, let’s look at what was moving markets last week.
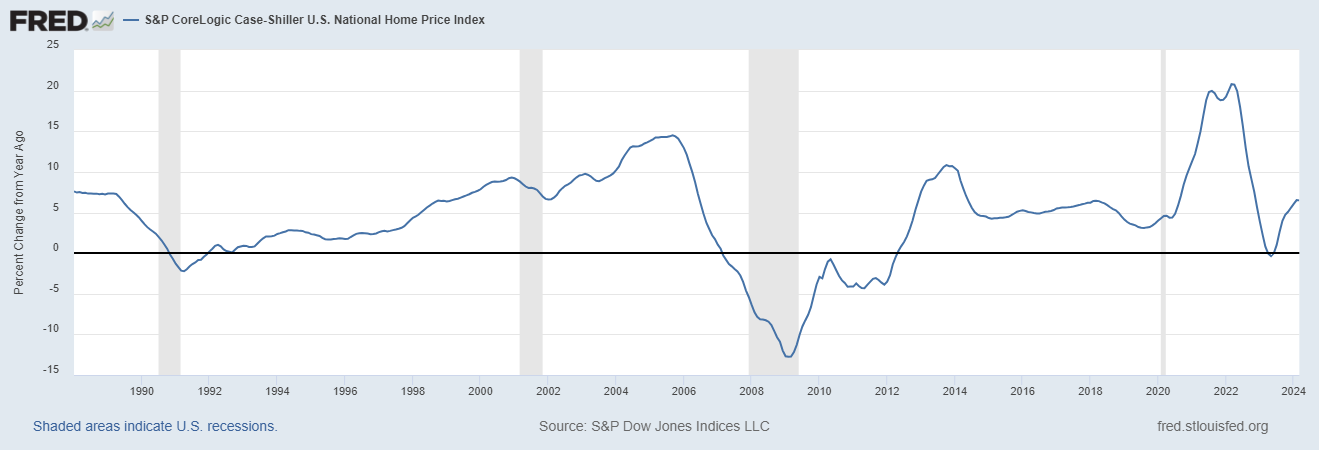
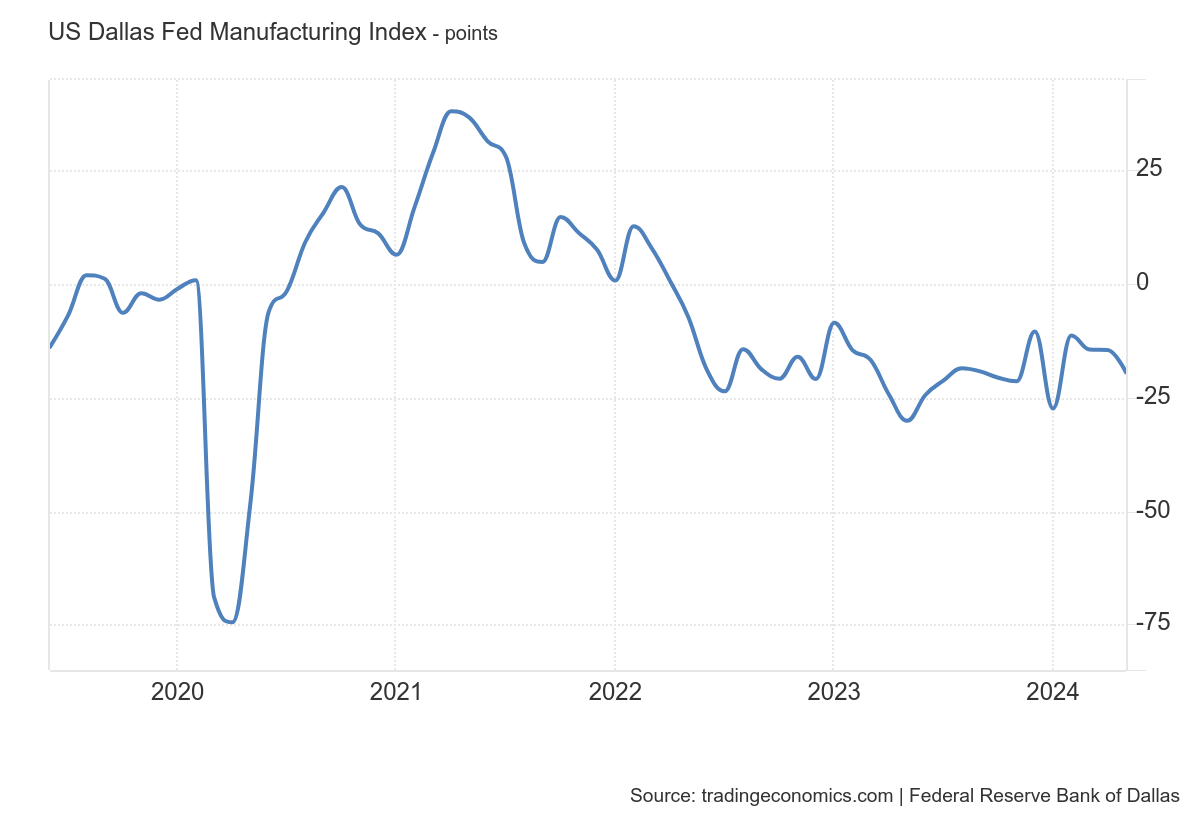
Interest rates shot up 18 basis points on Tuesday and Wednesday and while that didn’t change any trends, it is a pretty big move for a couple of days with no obvious catalyst. There was some economic news but it was largely offsetting. The Case Shiller home price index for March was released and rose to a new record, up 1.6% month to month and 7.4% year over year. That obviously isn’t good news but rising home prices aren’t new or shocking at this point. The other economic news on Tuesday was the Dallas Fed manufacturing survey which came in at -19.4, which was worse than last month but not significantly different than it has been since mid-2022. The Dallas Fed survey was once just a good indicator of oil drilling activity but that is less true today because the Texas economy has diversified over the last 10 years. In any case, the weakness in this report would seem to offset the potentially bad inflation news of home prices.
Also, on Tuesday the Conference Board released its Consumer Confidence index which rose to 102 from 97.5 last month. The Present Situation and Expectations indexes also improved but the Expectations component remained below 80 which is the Board’s threshold for recession. So, improved but still not great and really no reason to push rates higher.
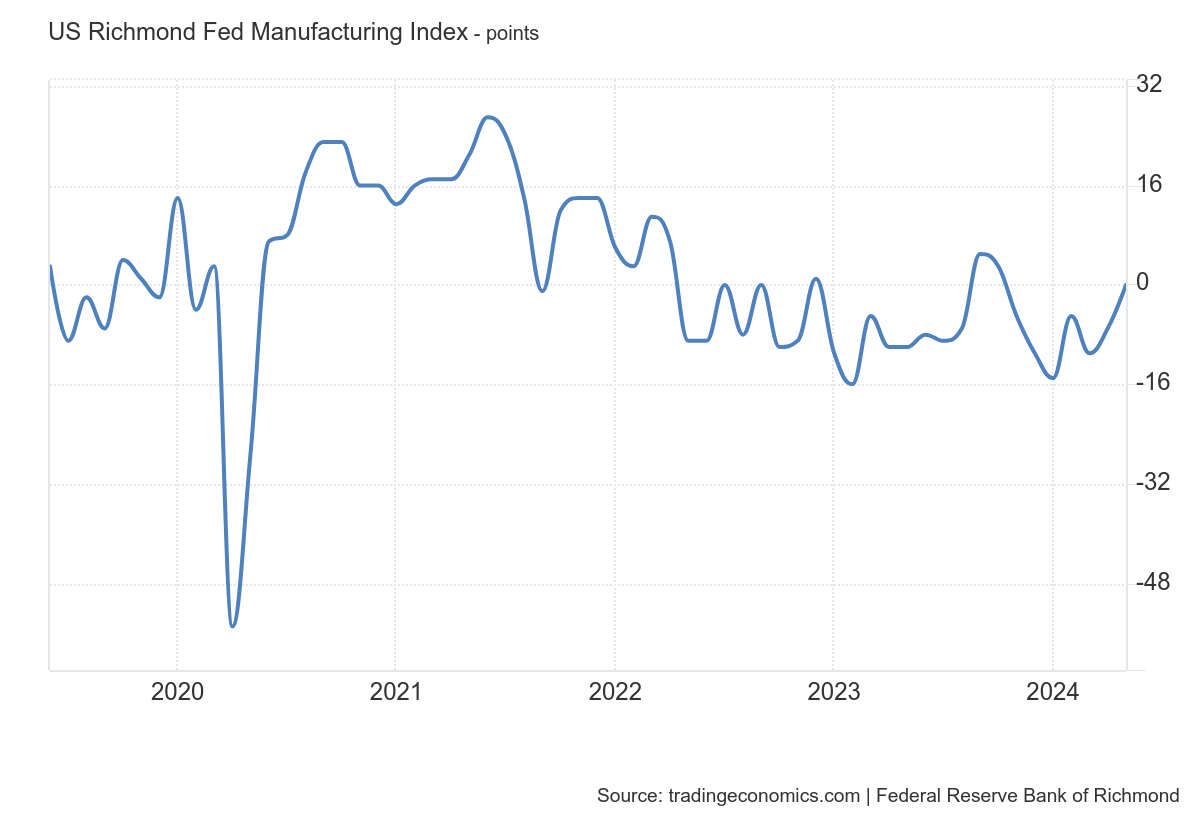
Wednesday brought the weekly report on mortgage applications which – surprise – were down. The housing market is weak and that isn’t news to anyone. The Richmond Fed Manufacturing index rose to 0 from -7 the previous month but that isn’t exactly a boom. There was an increase in shipments and new orders although the latter stayed negative. Their employment index fell further into negative territory. The services index turned positive but the Dallas Fed Services index, released at the same time, turned more negative. Like the Philly Fed survey last week, the Richmond version does appear to be turning up but at a slow pace.
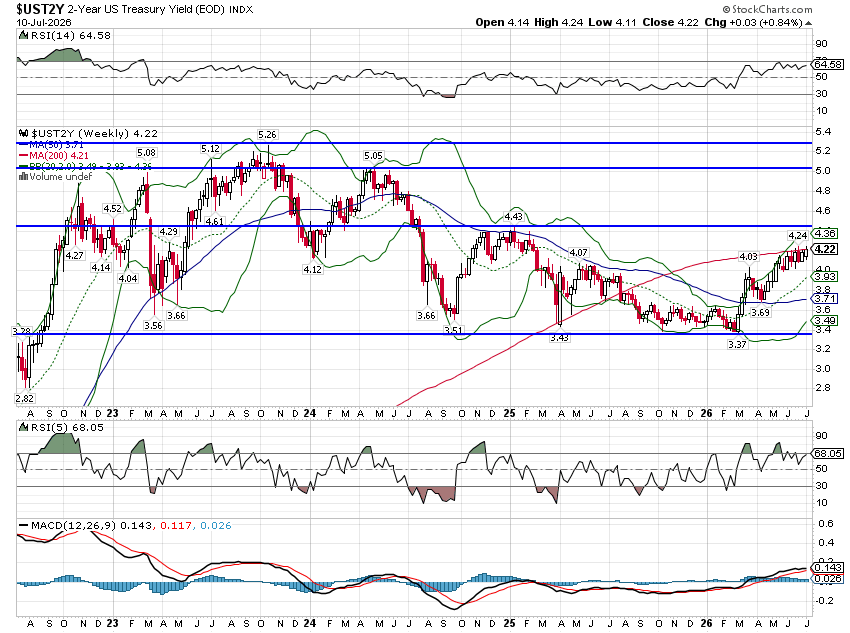
Again, there was nothing in these reports that should have moved the bond market but over the course of those two days, the 10 year Treasury rate rose 18 basis points. What’s interesting too is that it wasn’t all about inflation because the 10 year TIPS yield also rose 11 basis points. In any case, that was the peak for rates last week. Stocks and REITs were both down over those two days with the S&P 500 outperforming by being down about 0.7% while more interest sensitive small caps and REITs both fell about twice that (1.5% and 1.6% respectively).
The data for the rest of the week was bond friendly and rates fell on Thursday and Friday. The second estimate of Q1 GDP was 1.3% versus the originally reported 1.6% and consumption within that report was downgraded from an initial 3.3% to just 2%. New jobless claims were steady at 219k which still shows a strong jobs market but no different than it has been for months.
Friday brought the most anticipated news of the week in the form of the Personal Income and Spending report which includes the PCE price index, the Fed’s preferred measure of inflation. The data was largely as expected with Income up 0.3%, Spending up 0.2%, headline PCE prices up 0.3% and core PCE prices up 0.2%. The core number was maybe a little better than expected as I saw a lot of 0.3% estimates but it was right in line with the Cleveland Fed’s real time inflation tracker. These were obviously bond friendly numbers and at the end of the week the 10 year yield was up just 4 basis points – a lot of volatility but not much net movement. The S&P 500 fell again Thursday and for most of the day Friday, down 2.1% for the week at the low. Small cap stocks and REITs rallied on Thursday and Friday and both closed the week higher. The S&P staged a furious rally at the end of the day Friday (50 points in the last hour) to close the week down just 0.5%.
The movement in the stock market for the week looks bland but under the surface there were some incredible moves by individual stocks. Nvidia earnings were what everyone was waiting on and while the numbers were good, a lot was already baked in that cake. The stock rose on the news, up nearly 9% on the week at its peak before closing up just 3%. Interestingly, it fell on Thursday and Friday as the rest of the market was going the other way. But the move in Nvidia was mild compared to some other stocks last week. Software stocks were clobbered even as they beat estimates because most of them reduced their outlook for future earnings. It appears that software is where companies are cutting back to fit in the new AI spending. Salesforce (CRM, AIM owns) dropped 20% on Thursday but rallied back 7.5% on Friday. Other tech stocks also had big swings. Snowflake was down 13%, MongoDB fell 32.5%, Agilent fell 13%, Dell down 13%, Nutanix dropped 24%. Winners like HP (HPQ, AIM owns, +11.4%) were rarer and the Nasdaq closed lower by 1.6% for the week. Was that the top in the AI fueled tech rally? Maybe but we’ll need more than one week to figure that out.
There were big winners outside of tech like Gap Stores (GPS, AIM owns), up 29% Friday after a stellar earnings report and 38% on the week, Best Buy (BBY, AIM owns) +19% for the week, Abercrombie & Fitch +15%, Dick’s Sporting Goods +20% for the week, Academy Sports +8% (ASO, AIM owns) and Foot Locker +26%. You might notice a theme there.
I’ve been doing this for over 30 years, and I don’t remember ever seeing the number of +/-20% moves in individual stocks I’ve seen over the last few years. It isn’t confined to earnings report days either; a stock we own rose 15% one day last week because some brokerage firm I’ve never even heard of upgraded it to buy. But maybe my memory is faulty because Factset reported this week that for the quarter so far (with 98% of the S&P 500 having reported), negative earnings surprises are producing bigger moves than average but positive surprises are not. In aggregate, with optimism about earnings rising all quarter, I guess that isn’t surprising. And by the way, analysts are busy raising estimates for next quarter right now. Usually, earnings estimates fall at the beginning of a quarter as analysts digest the conference calls but this time, they’re on the rise. The economy may be slowing some, but it isn’t showing up in corporate earnings, at least not yet.
All in all, with so little news of any importance, it was a more volatile week than it should have been, or I guess than I would have expected or liked.
Last week’s economic data, while largely as expected and benign, perfectly captures the conundrum Kashkari and the other members of the FOMC face. The Case Shiller index, reported at the beginning of the week, showed house prices still rising rapidly despite the Fed’s rate hikes although the volume of transactions has fallen. Or maybe it’s because of the reduced activity that prices continue to rise. If you’re on the FOMC you worry that reducing rates now would just increase house prices even more, which will eventually feed through to the inflation indexes. I do wonder though if cutting rates might actually produce the opposite effect as it draws in inventory from homeowner’s delaying a sale because they have a 3% mortgage. Would more inventory offset higher demand? Lower rates might also increase the number of new homes being built. Maybe, but I’m afraid we may not find out; history says the Fed will wait too long to cut rates just as they waited too long to hike them.
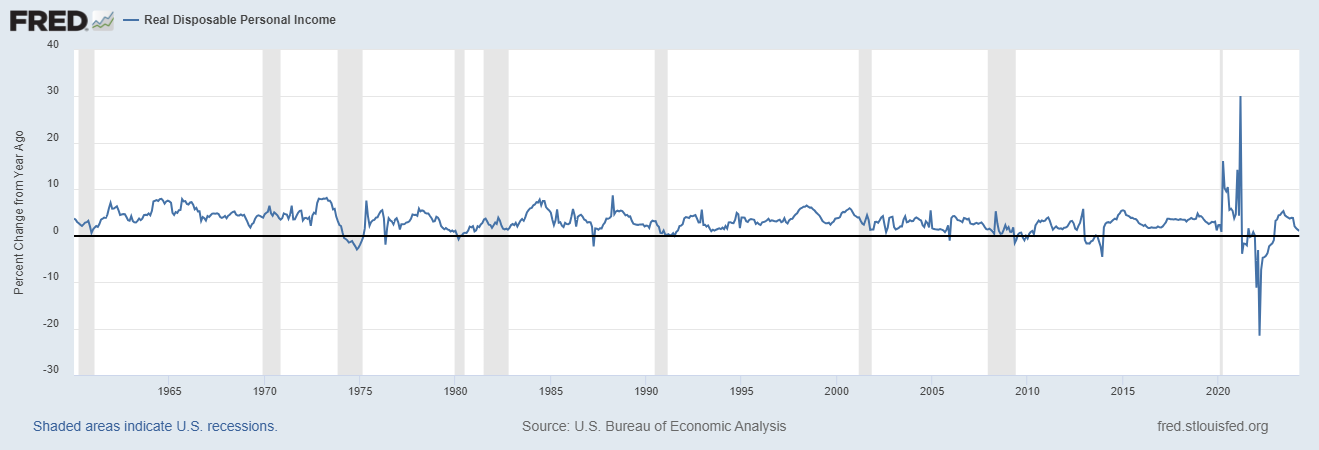
On the other hand – and you knew there was another hand – the data at the end of the week is worrisome from a growth standpoint. Real Disposable personal income was down on the month by 0.1% and the average year over year change the last three months has fallen to just 1.3%. For context, the long term average since 1960 is 3.1%. For more recent data, it averaged 2.6% in the 90s, 2.4% in the ’00s and 2.3% in the 2010s. Since 2019, which includes all the big swings from COVID, the average is 2.2%. It has been falling steadily from a year over year change of 3.8% in December to a 2.3% average yoy change over the last six months to 1.3% over the last three. That’s starting to look like a – worrisome – trend.
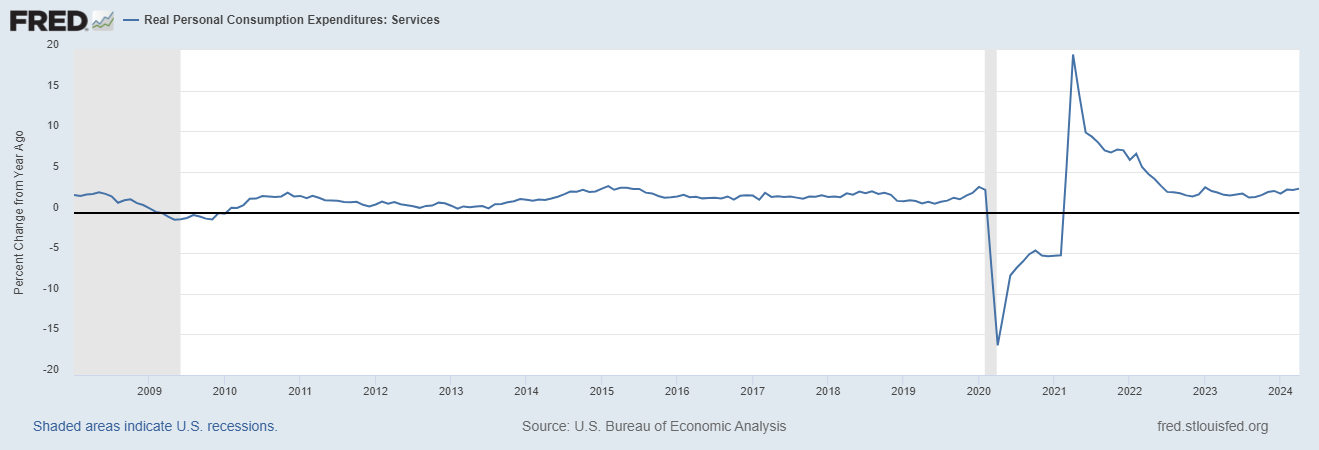
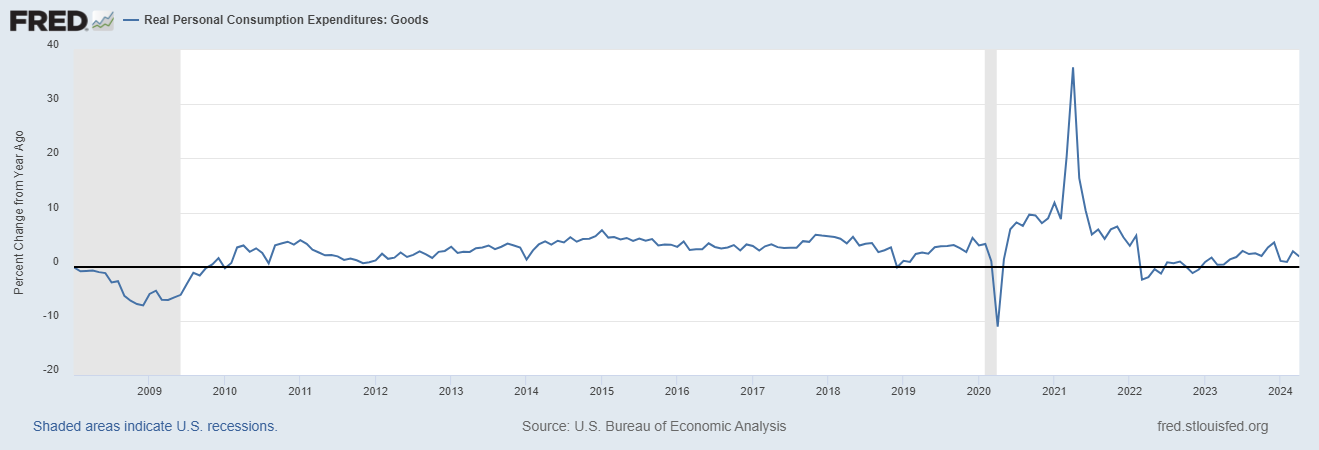
On the consumption side, real spending on services is rising at a health pace (+2.9%) but goods are struggling (+1.9%). These are not recession levels by any stretch – real goods consumption was down over 7% yoy in December of 2008 – but with income growth slowing, there seems a decent risk of further deterioration.
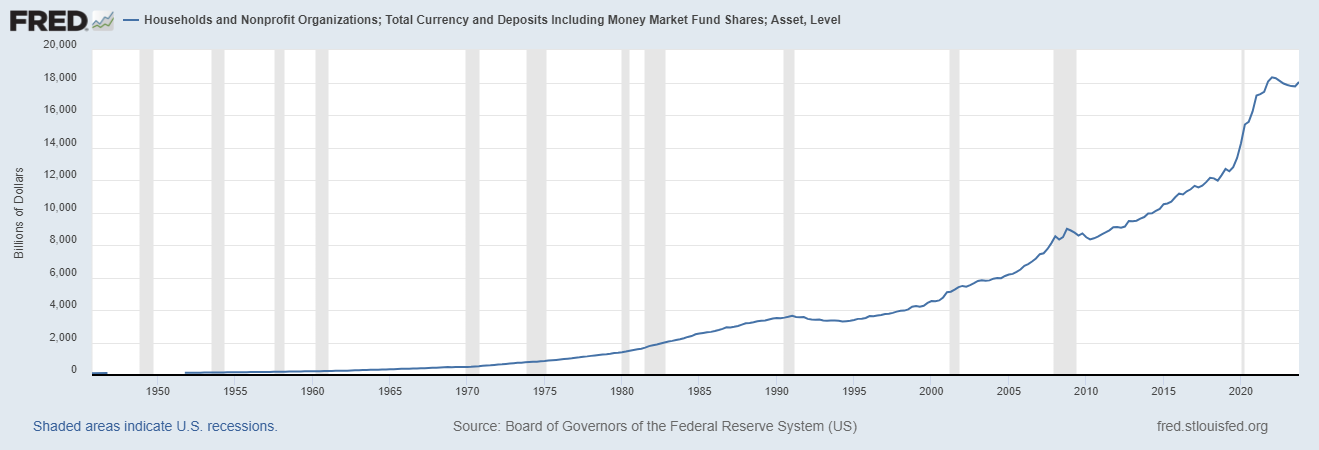
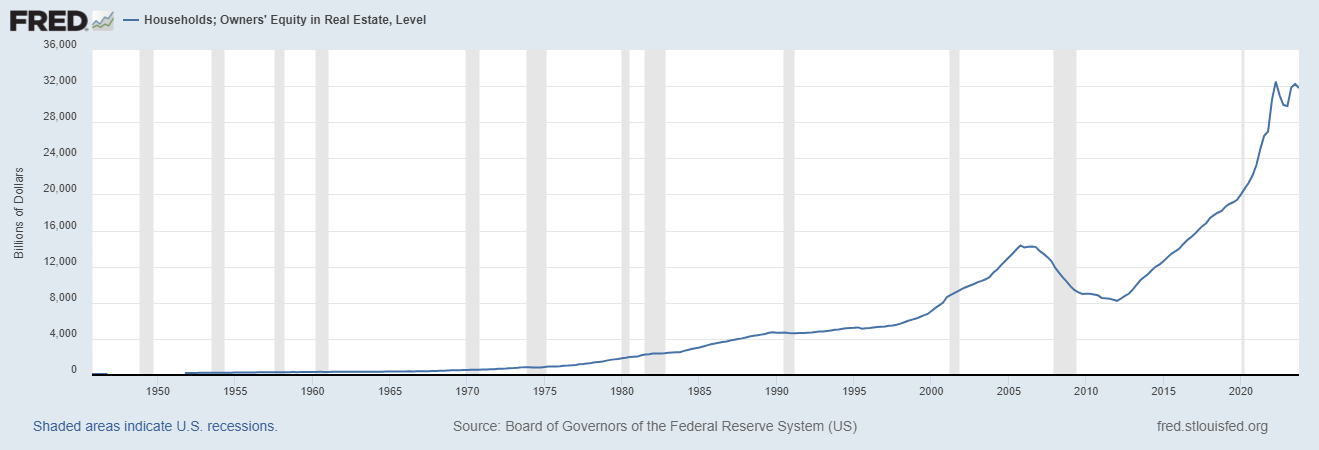
With inflation in house prices and a potentially weakening economy, the Fed faces a tough choice. Fed history on timing isn’t kind but it does seem as if Jerome Powell is intent on not making the same mistake twice. I think that’s why he turned more dovish late last year and I suspect he’ll want to cut sooner rather than later. But he doesn’t get to just move rates when he wants to; he’s the chairman but he can’t act alone. Will the rest of the committee go along? Kashkari and some others sure don’t sound like it. And maybe for good reason. There are still plenty of positives out there from an economic standpoint and some signs that the manufacturing part of the economy is starting to recover from its slowdown of the last two years. The Richmond Fed survey mentioned above, the Philly Fed survey released last week along with the S&P PMIs also released last week, all point to some improvement. And while income growth is slowing there is still a large pile of savings Americans can draw on to maintain spending if they want. They’re also sitting on $32 trillion in home equity and if rates fall, some of that might get tapped.
Here’s one more reason you might see a pick-up in production:
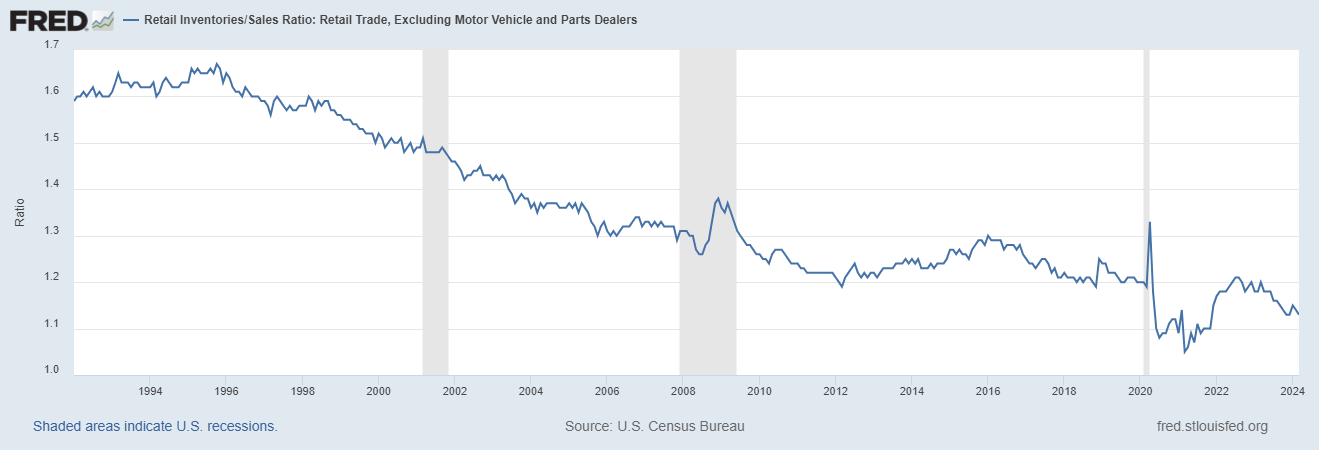
That’s the Retail Inventories/Sales ratio ex-autos. I excluded autos because, while the auto inventories/sales ratio is still below the pre-COVID level, it has been rising. The rest of retail though has been busy working down inventories and the ratio has been falling for months. It is well below the pre-COVID level and with some retailers (see above) reporting good sales, it is only a matter of time before they start the restocking process.
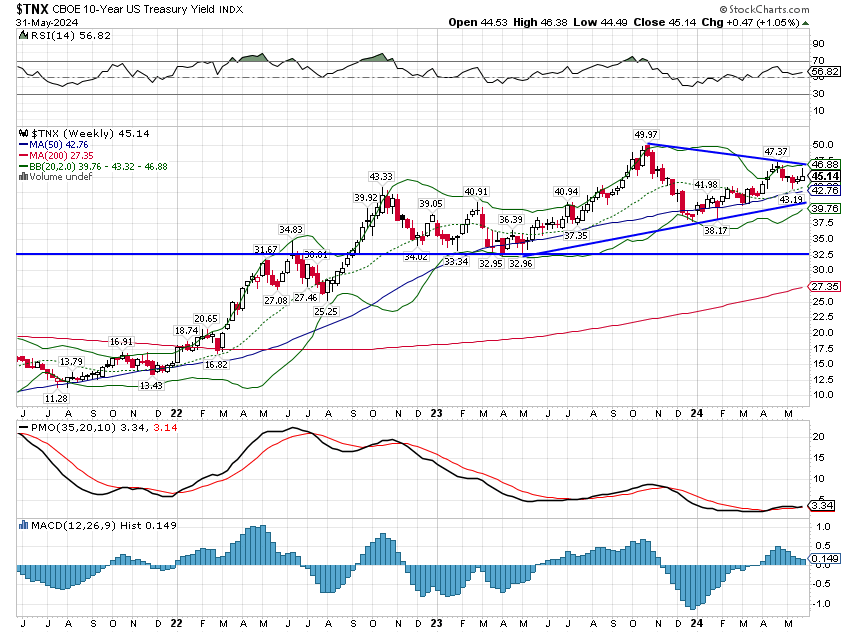
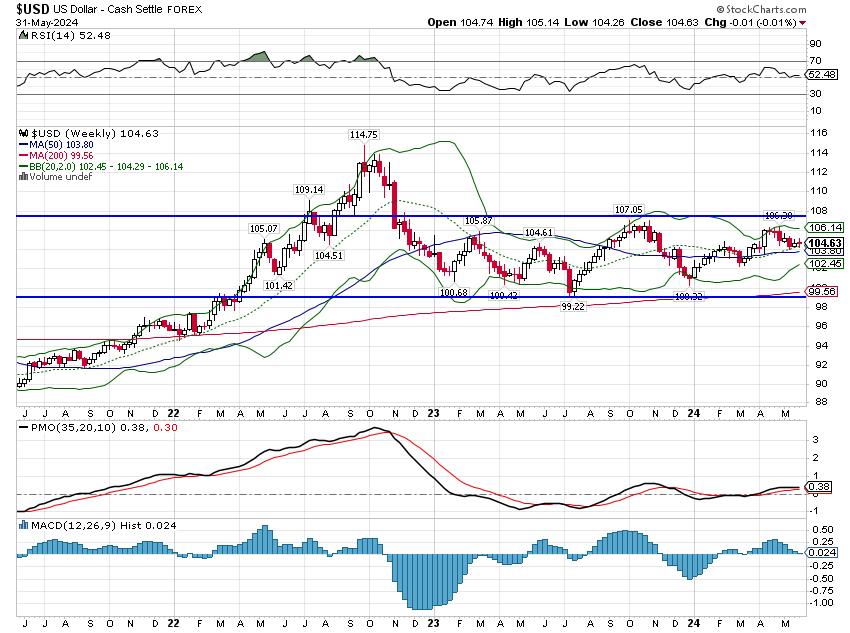
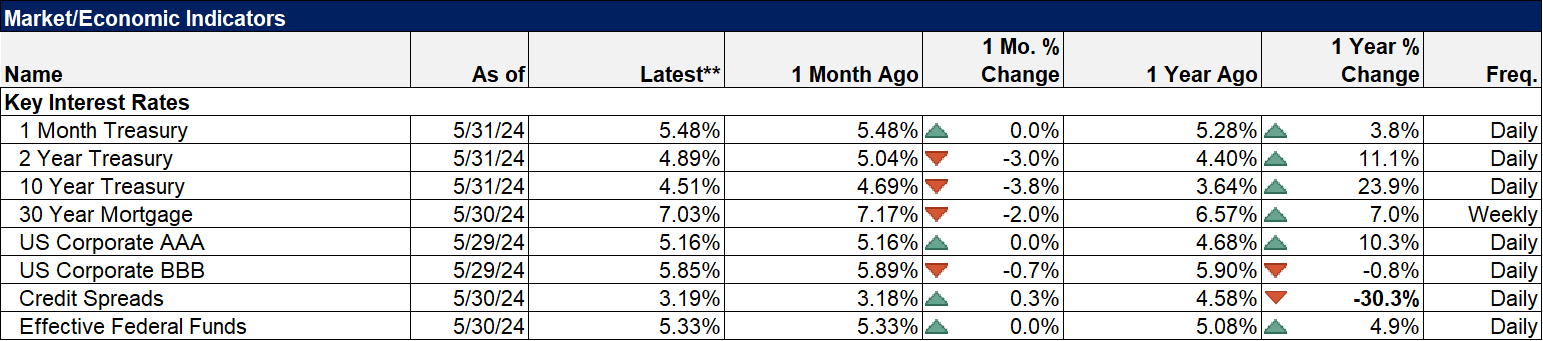
The market is not acting as if we are on the doorstep of a recession. Neither is it acting as if inflation is about to reverse higher. The 10 year Treasury yield was up 18 basis points in two days last week. It’s also up 18 basis points since October of 2022 and down 49 basis points from the highs of October 2023. The dollar is unchanged since November of 2022. Credit spreads are near the lows of the last two normal economic cycles (excluding COVID). A pessimistic view is that they only have one way to go from here – up. But in the past, the low of the cycle wasn’t near recession. It usually takes some time for widening spreads to impact the economy.
Will the Fed get it right? Can they get it right? Maybe they don’t have as much impact on the economy as they – and everyone – think. They can certainly impact the markets and that does affect the economy, but economies are also responding to all kinds of market signals that the Fed has no control over. What impact does the Fed have on the evolution and adoption of AI? None that I can see. There are millions of things going on in the global economy that can’t be predicted or aren’t being widely observed or analyzed by the Fed or anyone else. Interest rates play a role but maybe not the dominant one central bankers and economists believe. That’s why I rely on markets to guide me on the economy and right now, markets are not sending up any recession flares even if they are giving me heartburn.
Environment

The trend of interest rates and the dollar were unchanged last week. The short-term trend for rates is up but essentially unchanged over the last 18 months. The dollar has been trending sideways in a range from 100 to about 106 for the same period.
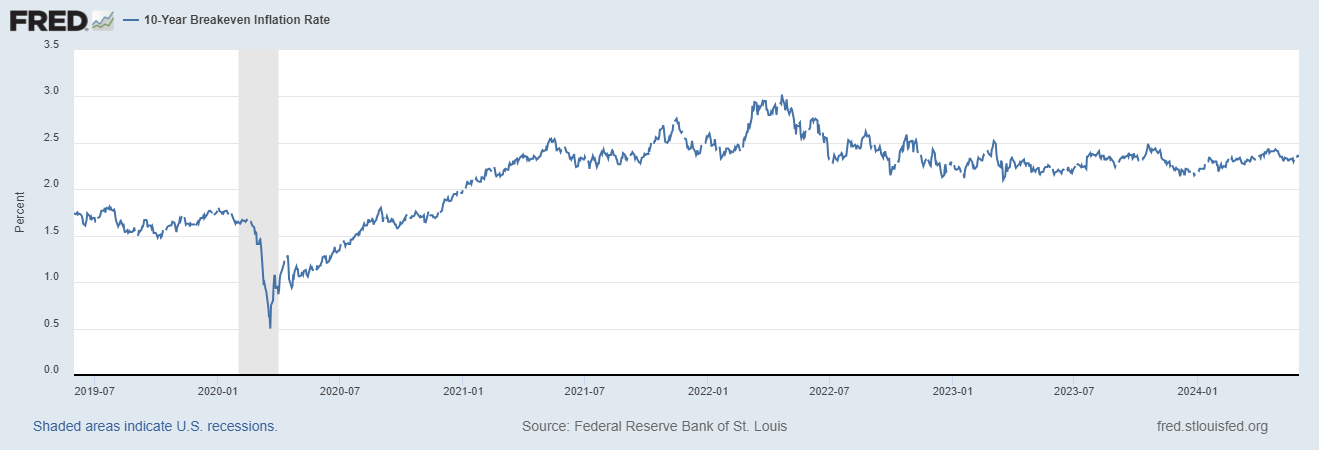
Inflation expectations have been steady since the summer of 2021 when the inflation rate peaked.
Markets
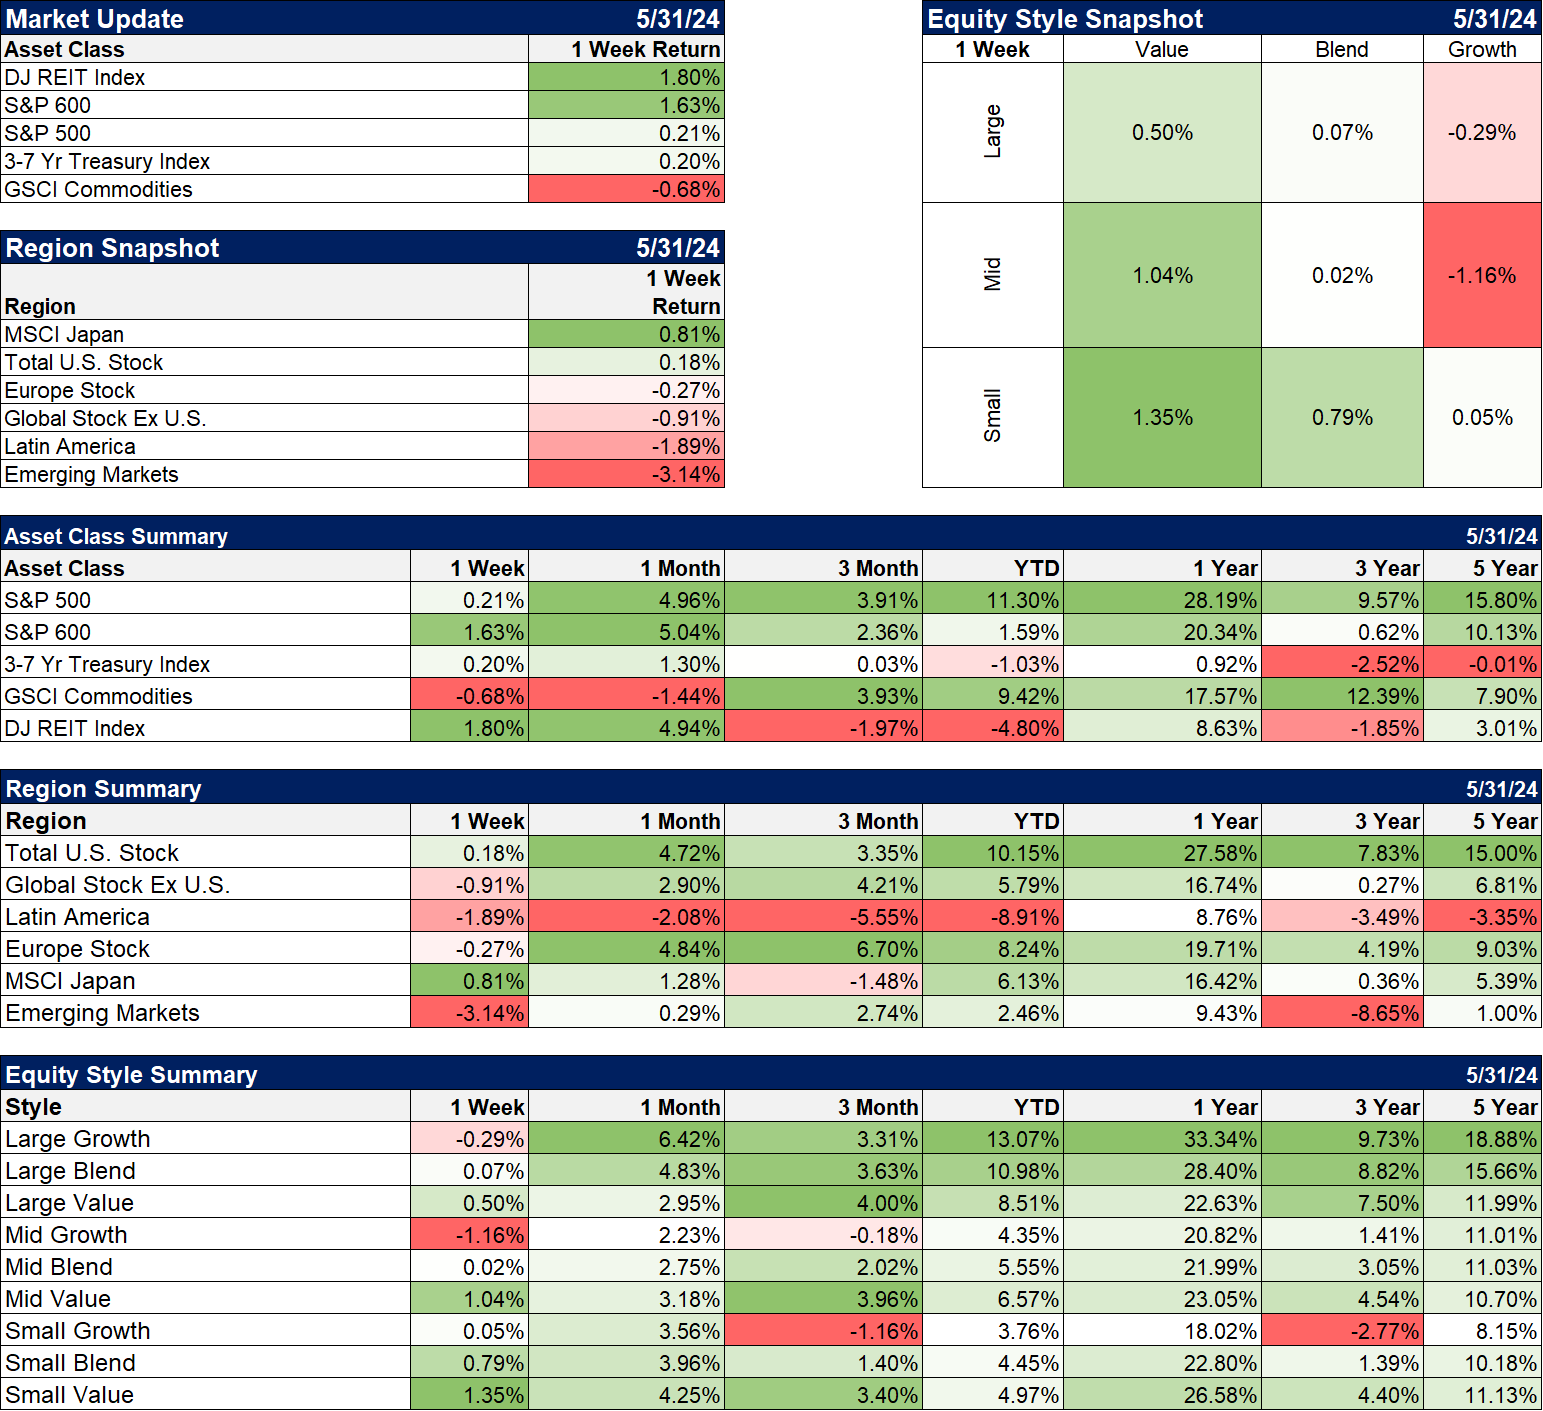
Note: The weekly returns below reflect the last 5 days of trading, not the calendar week.
Everyone thinks of themselves as contrarians but truly contrarian investments are hard to pull off psychologically. Being in the crowd is validating while going against it is isolating. What does it mean to be contrarian today? I can’t think of anything more contrarian than buying REITs and bonds right now. Both are down over the last 3 years and have the worst returns of the major asset classes we track over the last 5 years. No one wants to buy REITs right now and everyone is crowded into the short end of the curve buying T-Bills instead of notes or bonds. So, what happens if rates start to fall from here? History says that REITs will have an explosive move up and longer duration bonds will outperform T-bills and other short-dated paper. When rates peaked in late October last year and the 10 year fell from 5% to 3.8% by the end of the year, REITs rallied 25% in 8 weeks, outperforming the S&P 500 (+14%) and the Nasdaq (+16%). The 20+ year Treasury ETF (TLT) beat stocks (+19%) and the 7-10 year ETF (IEF) also performed well, especially on a risk adjusted basis (+8%).
The question is whether rates are due for another similar fall and there is no way to know the answer to that. If nominal growth continues to grow at 5% or better the answer is no but if inflation continues to moderate and/or real growth stumbles, rates will likely fall fast because sentiment on long term bonds has been negative for a long time.
It is easy to say you should be greedy when everyone else is fearful and fearful when everyone else is greedy but doing it is hard. Right now, that would mean buying things like REITs, value stocks, international stocks, small and mid-cap stocks and longer-term bonds. The problem is that REITs, value, small and midcaps and international stocks have underperformed badly for the last decade and there seems little reason for the trend to end. But that has been true in the past too and it always has. International stocks underperformed for most of the 90s as everyone ran to the US markets to participate in the dot com boom. But when the tide turned, international outperformed by a wide margin from 2002 to 2007. Indeed, from 1970 to 2010 the returns from EAFE (non-US developed markets) and the S&P 500 were almost exactly the same. The period since then has pushed the S&P into the lead again. When will the pendulum swing in the other direction for international? Value? Small/midcaps? REITs?
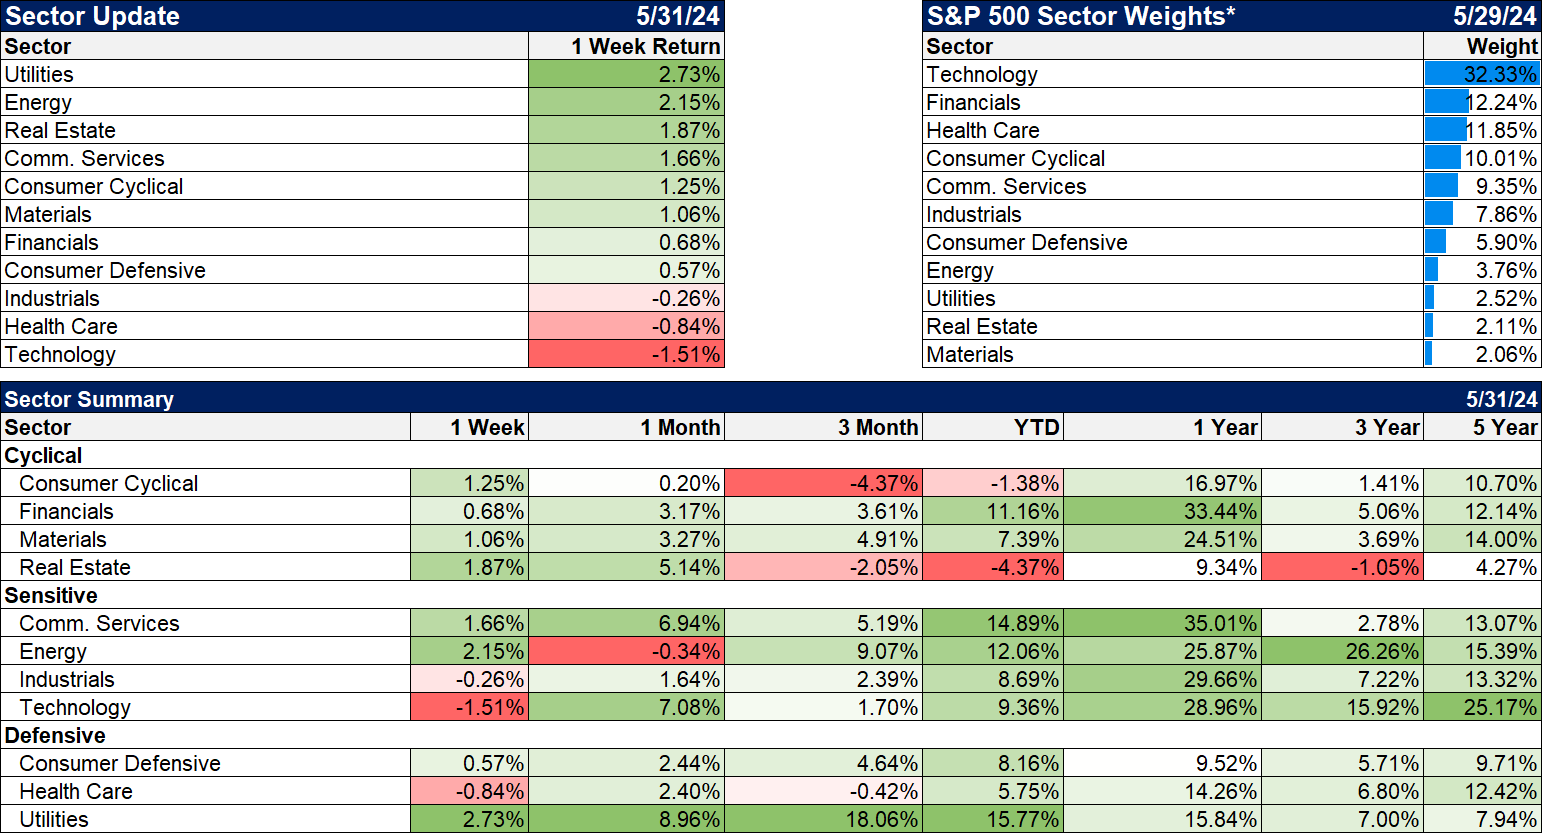
Sectors
Energy and utilities outperformed last week. Utilities have been leading for a number of weeks on the “AI needs more power” theme but I think that is getting way overdone. It is true that power needs are rising but it is also true that Europe and the US (mostly CA) have seen wholesale electricity prices turn negative for significant stretches recently. Excessive production of solar and wind power and no way to store it have pushed prices down. If new capacity is built I think you can count on it being natural gas and maybe nuclear over the longer term. Is that positive for utilities? I’m not as sure as everyone else out there mostly because I’m beginning to think the AI boom may prove short lived. There was a big improvement in large language models at first but they’ve trained these things on the entire internet by now and it still has some serious limitations. Companies are spending billions and generating savings of…not much yet. Just fyi, 67% of utilities have reported revenue below estimates in the most recent quarter; analysts may be getting too bullish.
Energy on the other hand – old fashioned fossil fuels – seem likely to endure for at least a few more decades and the stocks are still cheap (11 to 12 times next year’s earnings) and estimates are rising. By the way, in reference to the contrarian comments above, do you know what the worst performing sector was in the 2010s? That would be energy. Since the start of the 2020s, technology is the best performing sector but #2 is…energy. The worm always turns.
Market/Economic Indicators
Economic reports this week:
ISM manufacturing and services PMIs
JOLTS – job openings
S&P PMIs final for May
Non-Farm productivity/Unit labor costs
Employment report, ADP and official
More By This Author:
Weekly Market Pulse: Is Perception Reality?
Non-Traded REITs: Why?
The “Good News” On Inflation


Comments
Log in or sign up to join the conversation.