
We Very Likely Have Seen An Equity Market Peak As Biotech, Junk Fall Along With Bond Yields
Summary
- Several impressive price developments conclude that market peaks have been seen. First was PAM member jdefp's EWP measurement of ESc1=3338.38 as 161.8 Fibonacci level, measured off the 2018 end-of-year decline.
- Second, fall in Fed Reserve repo purchases, as well as liquidity conditions described in PAM's January 23 SA article; third, Fed's balance sheet has been reduced; the trend continues to March.
- JNK, HYG, LABU, XBI, and Financials are also collapsing in pursuit of sharply declining bond yields. Market leader NDX cannot stay aloft in these conditions: the markets will roll over and peak.
- With geopolitical and global health scare issues, as well as signs that the Fed is slowly devolving from very loose liquidity conditions to something that is more normal, risk assets are at significant risk, and bonds will benefit.
- It did look that ESc1 and NQc1 still needed to complete their wave 5s, and therefore did make new higher highs, but it seemed to us that RTY and Dow futures were done completing wave 2s structures (next wave 3 downside); therefore Biotech should be sold, which we did, largely.
This recent article was derived from a previous PAM report where we discussed the reason why we believed that the market was undergoing a market blow-off stage and that the conditions were ripe for a market peak. Therefore, PAM would be served well getting more proof so we can position to the downside, accordingly, which we did.
This new article discusses the proof and evidence we gathered which indeed proved to us on Wednesday, January 22, that market peaks were unfolding right before our eyes. Those findings were summarized in a report and sent to PAM subscribers and then published in the PAM blog the following day, January 23.
Pre-New York market opening, on January 22, PAM member @jdefp commented that he has ESc1=3338.38 as the 161.8 Fibonacci level target for a market peak, taken off the 2018 end-of-year decline. Those levels were then just a few points away from prices which were being tracked by equity futures being traded during European markets.
I described the Elliott Wave Principle (EWP) schemata as a "beautiful" market insight; accordingly illustrated in the chart below.
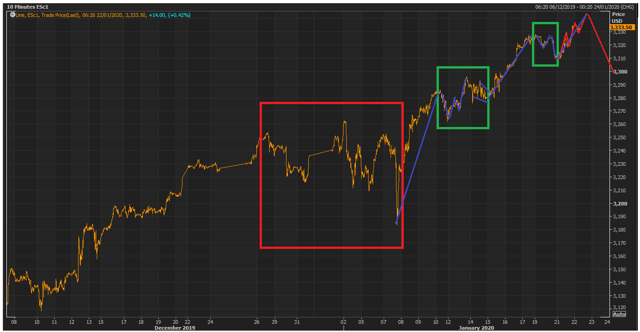
When the New York market opened on January 22, JNK, HYG, LABU, XBI, and Financials, as well as Small Caps collapsed in pursuit of the sharply declining 10yr yield. Market leader NDX cannot stay aloft in these conditions: the markets will roll over and peak, and did (see the two charts below).
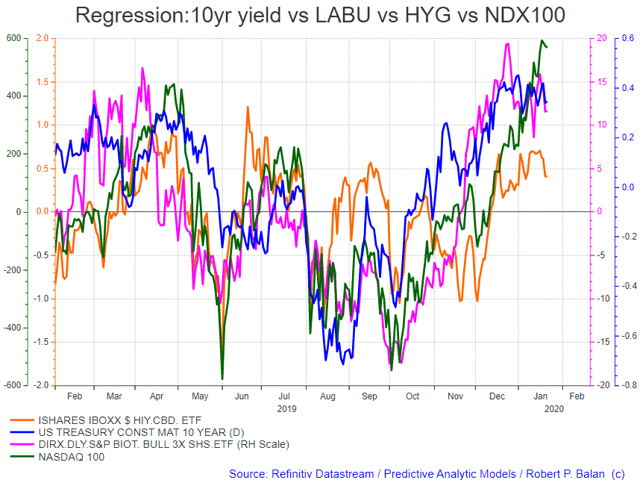
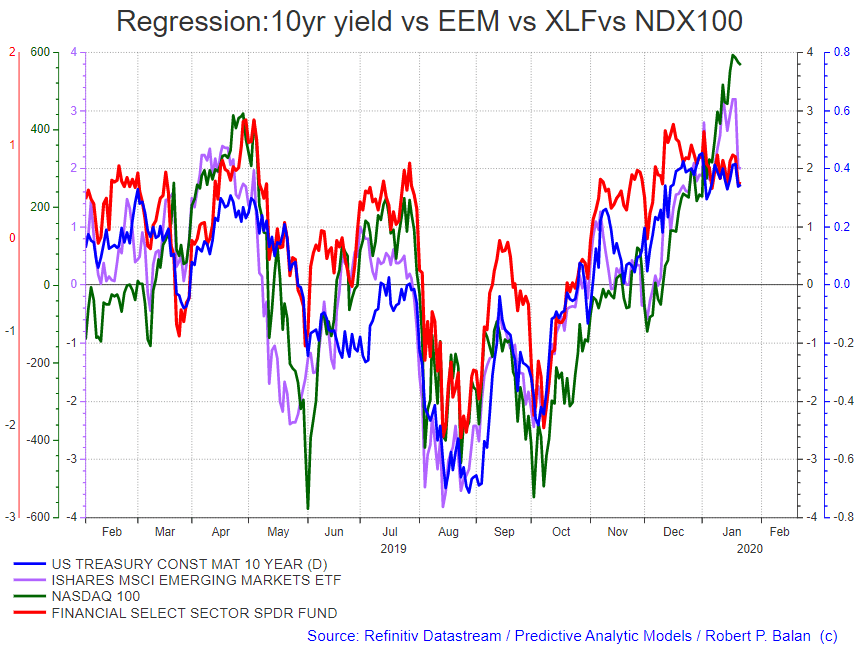
In our previous report, we said that if our assessment is correct, bond yields are going to fall sharply over the next few days, even weeks. That will force these bond yield proxies lower and presumably other sectors that fade when yields fall, like financials, a heavy-weight sector, which would pile on pressure on the Dow. On top of that, EM equities would front-run what would be subsequent undercutting of the major indices (see chart above and below).
We were also ecstatic because there were other important developments in the Federal Reserve's management of systemic financial liquidity, which were telling us that the market has to quickly adjust its perception of the central bank's easy money policies. In other words, Fed Chair Jerome Powell's supposed "put" on the equity market is starting to be dismantled.
Here is the first significant indication that the Fed is clawing back the liquidity flood it unleashed in Q4 2019 - repo purchases are now collapsing in nominal (stock) levels, as shown in the chart below (dashed black line).
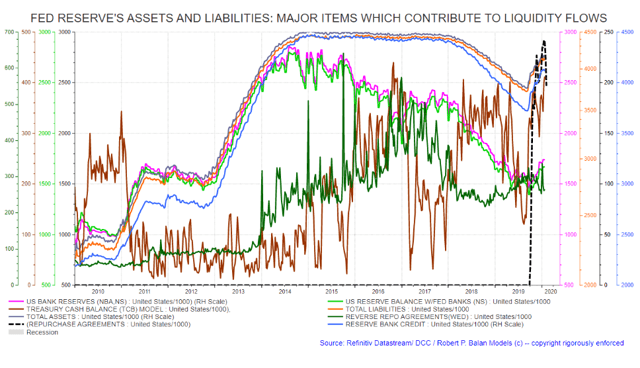
Here is another (an off-shoot of the repo purchase drop illustrated in the chart above):
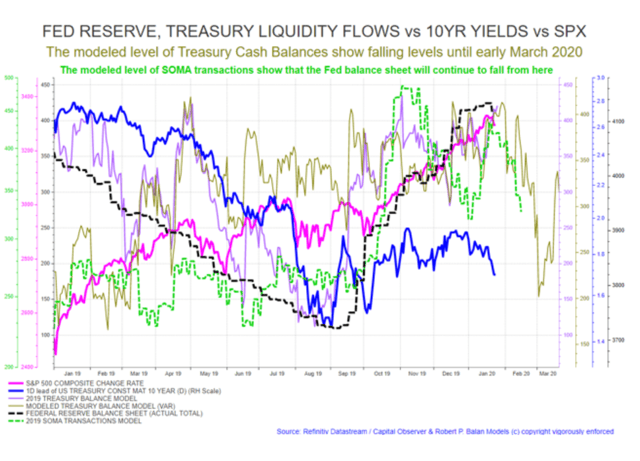
The total dollar value of the Fed's balance sheet is starting to fall (dashed black line, chart above). Our modeled change rate for the balance sheet falls sharply until at least the middle of February. Moreover, our modeled changes for the Treasury Cash Balance suggest this account will fall until early March, suggesting that SOMA activities (in dollar-value basis) will be falling until then.
That means total assets in the Fed balance sheet will fall, as well as its liabilities, meaning bank reserves and Treasury cash balances, as well as bank credit (credit provided by the Fed to commercial banks) will also fall. These are developments that are definitely not friendly to risk assets. Bond yields should therefore fall even further, as less liquidity pushes up the price of credit/bonds.
"Not QE" stimulus will end in March 2020, period
It is important to note that the "Not QE" stimulus, which many mistakenly tout as the next QE4, was undertaken by the Federal Reserve as auxiliary measure to ease the repo market seizure during Q4 last year. The Fed never promised to turn it into a full-scale Large-Scale Asset Asset Purchases (LSAPs) program, and indeed $60 billion monthly T-Bill purchases are scheduled to end in March 2020.
The Fed Reserve undertook that Permanent Open Market Operations (POMOs) to increase bank reserves, whose supply was then plummeting. Falling bank reserves always push up repo rates at unpredictable pace (see chart below), hence the Fed wanted to add more bank reserves to the system to anchor the rise of repo rates, if it happens.
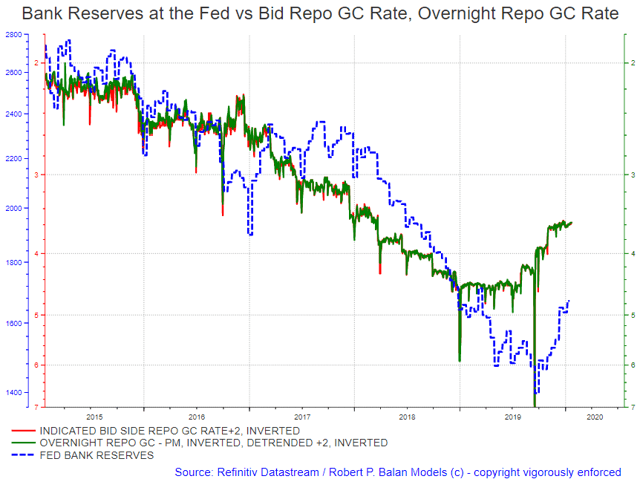
In Q4 2019, bank reserves have been falling due to the Fed's previous Quantitative Tightening (QT) program, and due to the machinations of large US banks like JPMorgan (NYSE:JPM), which siphoned off and withheld bank reserves from the repo markets, causing large-scale shortages and the subsequent blow-ups in repo rates. However, given the smooth transition of the repo market from a feared year-end debacle, the Fed will likely wind down "Not QE" program in March as scheduled.
With structural changes being proposed to prevent the repo market from blowing up again, there will be less and less future demand for ultra-short term loans to prop up the market, if financial institutions can go directly to the Fed to borrow repo loans. That also removes the incentives for large banks, like JPM, to squeeze the repo market for their own benefit and would presumably prevent frequent repo market seizures, as in the recent past.
That makes it very unlikely that the Fed will repeat the events of Q4 2019 in the repo markets, when it was forced to intervene with large-scale liquidity infusions to prevent a repo market blow-up.
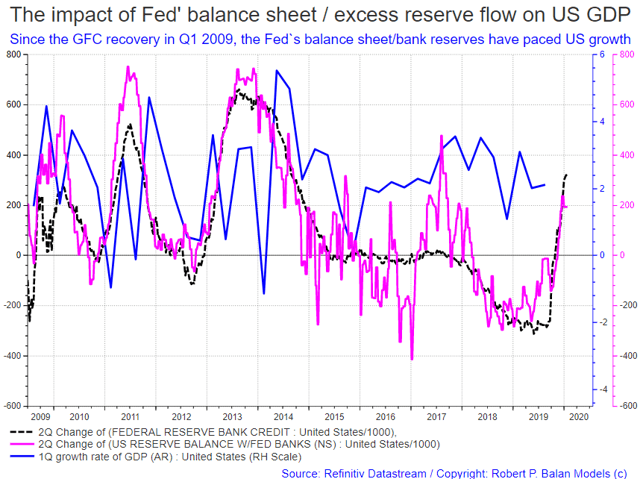
That will take away systemic liquidity that has been taken for granted by many market participants as given, as in memes like "QE Infinity". After March 2020, there will be a new game in the Fed's supply of funds, especially if Q4 2019 GDP will be significantly higher than those seen in Q3 (see chart below).
There will be less liquidity sloshing around.
The notion of a market top on Jan 22 was supported by the systemic liquidity situation
More importantly, the EWP projections and reduction of repo purchases dovetail with the plethora of analyses which we have done previously, pointing to a significant peak in equities which was in the process of forming.
From a systemic liquidity point of view, we were indeed confronted with the likelihood that we are seeing an equity market top at that time on January 22 (see the two following charts below).
A sharp fall in bond yields applies the same developing negative liquidity conditions to the equity markets. That is in addition to the negative effect of falling yields on several important market sectors.
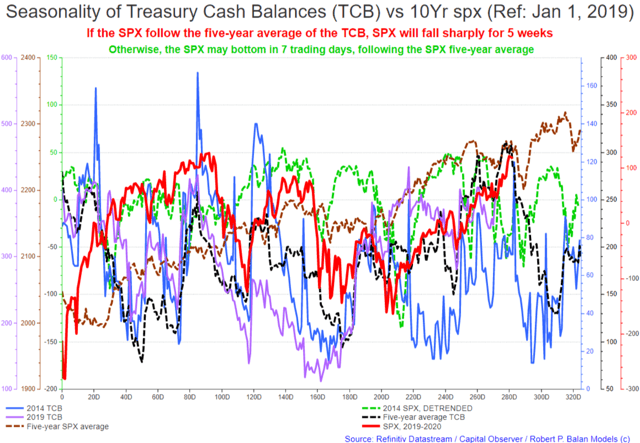
You will also see in the chart above that the SPX has reached the confluence of the apexes of its five-year average and those of the liquidity flows from the Federal Reserve and the US Treasury. The liquidity flows are turning against the markets.
The situation in yields was the most significant price development since Friday, January 17. If the 10yr yield follows the trajectory of outlier 2014 yield or five-year ave, yields will fall sharply. Otherwise, the 10yr yield may bottom next week, following the trough of the 10yr yield five-year average.
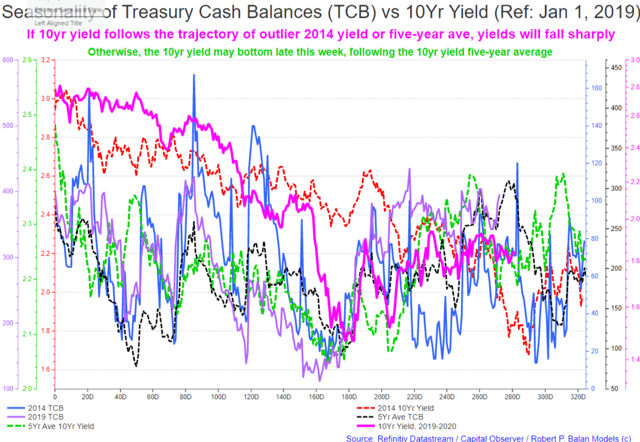
These conjectures for possible bottoms in SPX and the 10yr yield in the subsequent sell-off are here for the sake of being thorough. The reality is that most of the evidence pointing to a peak at that time, on January 22, also argues for a major trough appearing only in mid-March.
Fine-tuning the topping out process
It did look at that time that ESc1 and NQc1 still needed to complete their wave 5s, and therefore did make new higher highs, but it seemed to us that RTY and Dow futures were done completing wave 2s structures (next wave 3 downside), therefore Biotech (which are good proxy to bond yields) should be sold, which we did, large.
To round up the evidence that a significant market peak is on process on January 22, we added the monthly Federal government expenditures outlay to the mix. We previously described government budget outlays as the ultimate liquidity source, as it is the prime mover of the SOMA POMO transactions, and therefore the prime mover of the changes in the Fed's bank reserves and Treasury cash balances.
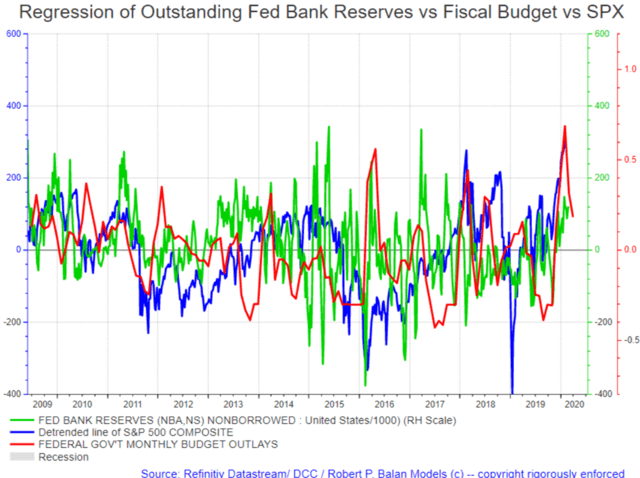
The flow from this overarching source of liquidity is obviously fading, and risk assets prices and bond prices should start feeling the underlying drought - that may have already started on January 22.
Conclusion
If the change in rate of federal government expenditures is fading, then the primary generator of POMOs which create the bank reserves that the markets so crave as a measure of liquidity will not be there to bail the market out.
If the Fed is starting to claw-back the flood of liquidity which it unleashed on Q4 2019 to calm the repo market, then falling volume of assets and liabilities is evidence that the Fed's "put" on the equity market is being dismantled.
Therefore, bank reserves and Treasury Cash Balances (TCB) will fall significantly very soon. Falling bank reserves and TCB wreak havoc on risk asset prices and will depress bond yields.
The blow-off stage has come to pass on January 22, the grand sell-off has started, and so we have correspondingly positioned to the downside as promised. We will track the market course lower, and when the time has come to take profits, and reverse course, we will duly inform you. We have the tools to do that too and will publish when we see it happening.
Disclosure:
I am/we are long GOLD, BONDS, EURO.
I wrote this article myself, and it expresses my own opinions. I am not receiving compensation for ...
more

