
US Treasury Ten Year Notes In Impulsive Rally
Short term Elliott Wave view in Ten Year Notes (ZN_F) suggests the rally from December 2019 low is unfolding as a 5 waves impulsive structure. Up from December 13, 2019 low, wave ((1)) ended at 131.29 and wave ((2)) pullback ended at 130.07. Wave ((3)) rally then ended at 136.23 and this can be seen in the 1 hour chart below. Wave ((3)) shows a 161.8% Fibonacci extension of wave ((1)) and the internal subdivides in a clear impulsive structure in lesser degree.
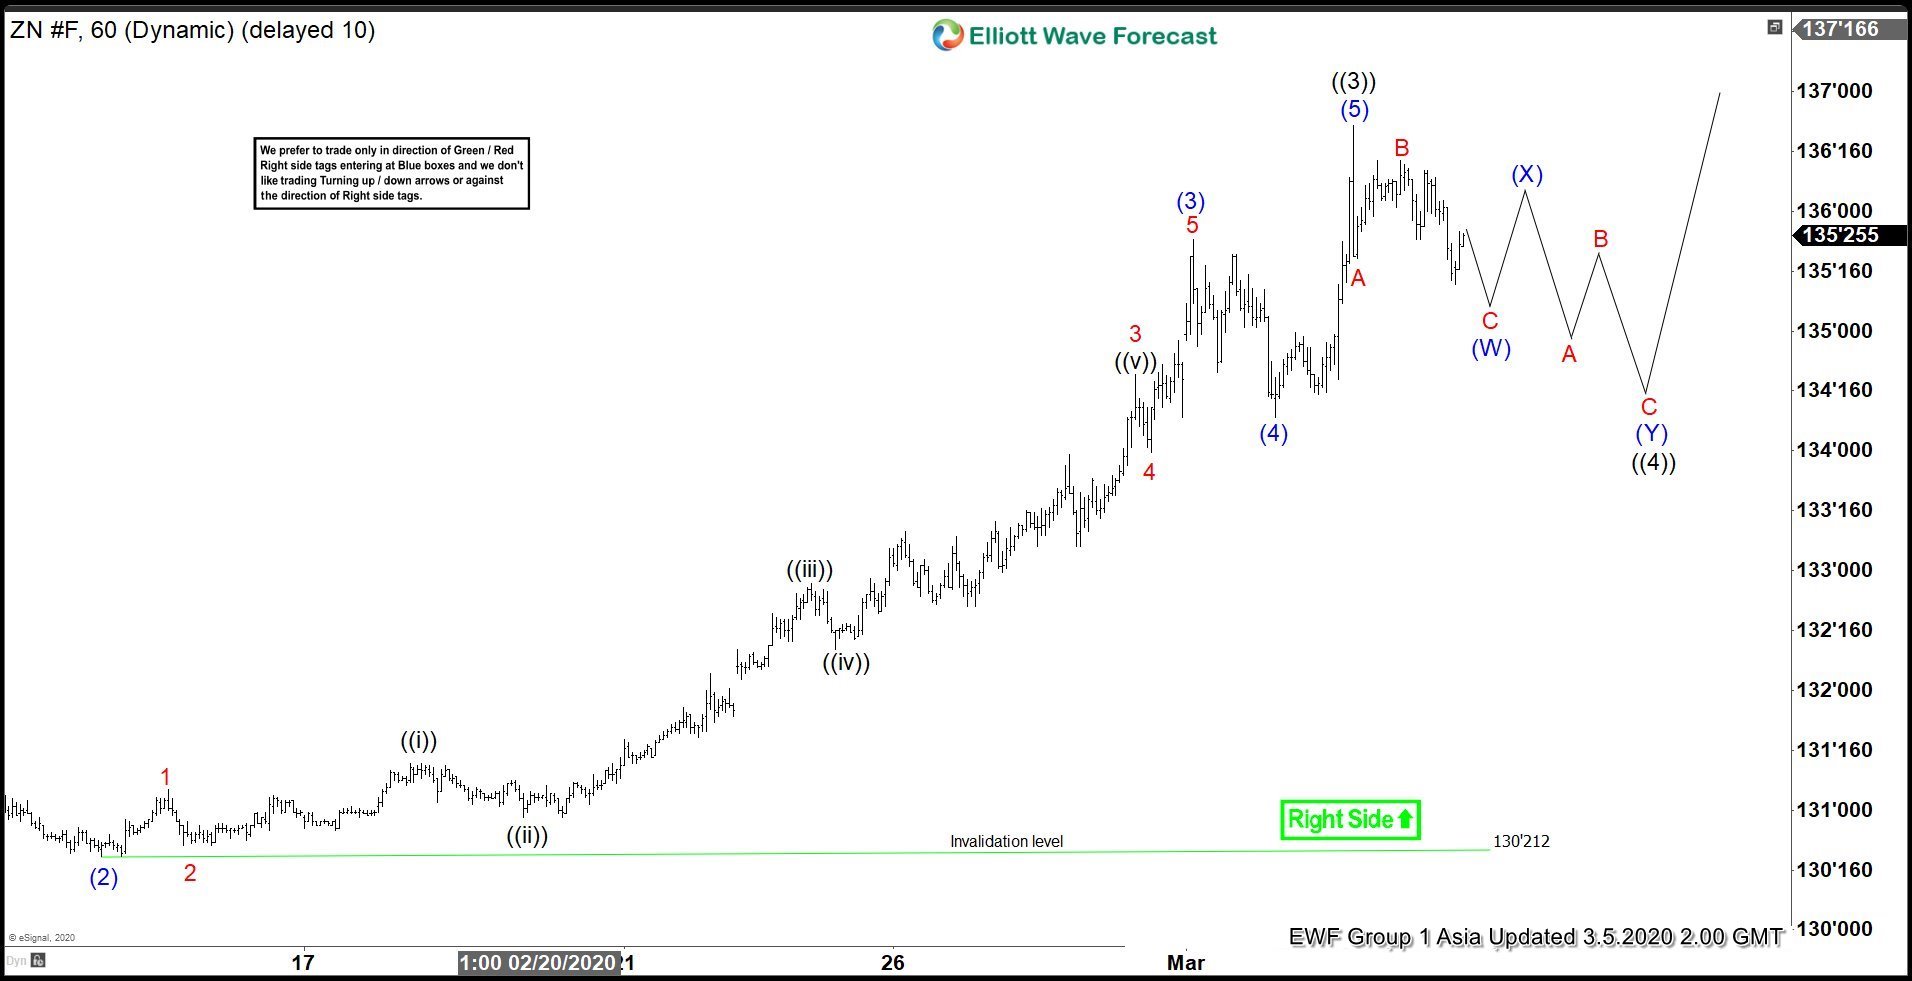
Up from wave ((2)) at 130.07, wave (1) ended at 130.28, wave (2) ended at 130.21, wave (3) ended at 135.24, wave (4) ended at 134.09, and wave (5) ended at 136.23.This completed wave ((3)). The Notes should now pullback in wave ((4)) to correct cycle from February 6 low before the rally resumes. Wave ((4)) pullback ideally doesn’t go below 50% retracement of wave ((3)) which is 133.14. Possible target for wave ((4)) is 23.6 – 38.2% retracement of wave ((3)) which comes at 134.06 – 135.04. Near term, expect pullback to find support in 3, 7, or 11 swing for more upside. As far as pivot at 130.2 low stays intact, expect the Notes to extend higher.
10 Year Notes (ZN_F) 1 Hour Elliott Wave Chart
Disclaimer: Futures, options, and over the counter foreign exchange products may involve substantial risk and may not be suitable for all investors. Leverage can work against you as well as for ...
more

