US 10-Year Treasury Yields Near 60-Year Lows
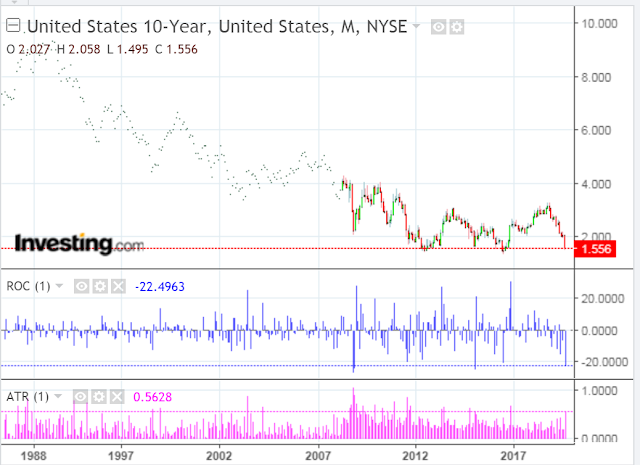
Once again, US 10-Year Treasury yields are approaching 60-year historical lows set in mid-2012 and mid-2016, as shown on the following monthly chart.
(Click on image to enlarge)

Shown on the next shorter-term monthly chart are the Rate-of-Change (ROC) and Average True Range (ATR) indicators (in histogram format and with an input value of one period).
Should this rate continue to fall, and, in particular, if it breaks and holds below the previous lows, I'd say that US equity markets would weaken considerably. In that regard, watch for accelerating larger spikes on both histograms for confirmation of further yield drops. Otherwise, watch for large sustained spikes to confirm a serious turnaround to the upside...with US equities strengthening.
(Click on image to enlarge)