
Transitory-ness In The TIPS Market
With all the debate about the persistence of inflation, one natural thing to ask is: what is the market pricing? Unfortunately for those who are selling a “return to the 1970s” narrative, “Mr. Market” is firmly in the camp of “Team Transitory.” Of course, one imagines that the immediate response is that the “markets are wrong.” Since many of the people in the “inflation is coming!” crowd are also in the “markets are always right” camp, there is a good chance they might modify the argument to “markets are wrong according to some affine term structure model.”
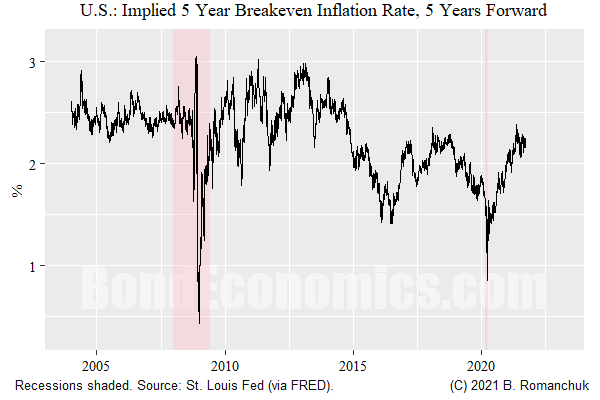
The baseline for our discussion is the most straightforward measure of “forward inflation expectations” is the figure above: the 5-year TIPS inflation breakeven rate, starting 5 years forward. I took the series directly as calculated by the St. Louis Federal Reserve as based on the Fed H.15 fitted Treasury rates, but they used the exact same approximation I would use in this circumstance.
To give a quick primer for those new to the topic, the “breakeven inflation rate” on an inflation-indexed bond (in this case, U.S. TIPS) is that future rate of inflation that gives the same total return as nominal government bonds (conventional Treasuries). That is, it is literally the rate of inflation where the two types of government bonds have the same return (break even). From the perspective of mathematical finance — as used in option pricing — this is where the expected inflation rate is, using the mathematical definition of expectation. One should keep this notion of “expectation” distinct from the notion of “forecast,” as I discuss below.
I showed the forward rate instead of the spot rate (a breakeven over the time period starting now) so that we can see what is priced in after current disturbances have subsided. (I did not even bother looking at spot breakeven inflation rates.)
As the chart above shows, the forward breakeven has recovered from the usual collapse we see in financial panics during the lockdown period, but are still well below where it was last cycle. (Which was too high in retrospect.)(My book Breakeven Inflation Analysis offers more information on this topic.)
I would argue that the only sensible takeaway from that figure is that inflation market participants are not deeply concerned about a secular rise in inflation. Beyond that, I do not have enough information to be more specific. My immediate concern is that the above time series is an approximation, and we really would need to dig in the details of bond-specific pricing to have more confidence in the exact level of forwards.
The reality is that TIPS market is not incredibly liquid, and there are fewer issues to work with. Meanwhile, an individual issue can have pricing quirks like seasonal effects based on its coupon dates. The figure above certainly gives the correct big picture, but one should not view the specific levels as being definitive at any point in time. Even without access to the instrument-specific data, I believe that it is fair to assume that error bars are currently larger than usual.
(The inflation swap market can give a cleaner read on forwards, but I am out of the loop with regards to the liquidity in that market currently. Inflation swaps always tend to be secondary to government bond inflation markets, since it is extremely hard to find anyone other than the central government willing to sell inflation protection in size.)
The reason why academics or central bankers will say the above reading is incorrect is because they have models that allege that the risk premia have been zooming around, and so the “real expectations” are way higher than observed breakevens. That is, the breakeven might be the mathematical expectation, but forecasts (“expectations” in common English) are higher.
One of the interesting things about fixed income is that outsiders insist that bond market participants routinely misprice bonds while within the bond market there are entire teams whose entire day job is to price bonds correctly. (I used to lead one of such teams.) Whatever.
The problem with the “risk premia zooming around” story is that it is unclear that any of the models offer useful information. They are internally consistent, yes. But do they offer useful information — where we measure “usefulness” by generating profitable trade analysis? In general, they do not pass that test. For example, it is entirely typical for the models to suggest that term premia in a certain part of the curve was heavily negative — and then the realized excess returns were quite positive, as any ignorant shnook fixed income quant could have told the academics.
In this case, I have some sympathies for demand for inflation protection forcing breakevens lower. But there is no way to get from there to a “1970s is coming!” narrative. At best, we are “really” just back where expectations were last cycle.
Disclaimer: This article contains general discussions of economic and financial market trends for a general audience. These are not investment recommendations tailored to the particular needs of an ...
more

