
This Summer Poses A Headwind For Stocks With Distant Earnings
With all eyes on the year-long run-up in small caps, it may be wise to note how many companies in the asset class are not turning a profit.
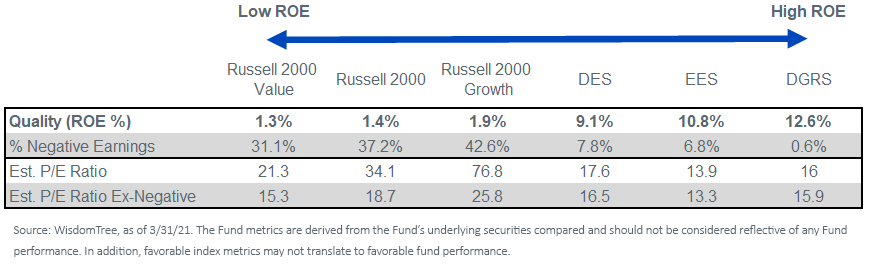
A particularly egregious violator: stocks in the Russell 2000 Growth Index. Companies with negative earnings comprise 43% of its market capitalization. Its value counterpart is not much better: 31% of the Russell 2000 Value is in negative earners, while the Russell 2000 itself has 38% with income statement red ink.
Many such stocks may not be prepared for a bullseye date: July 29, when the Q2 GDP report is published.
Look, Americans are getting back to it. I personally have flights booked. Normal life.
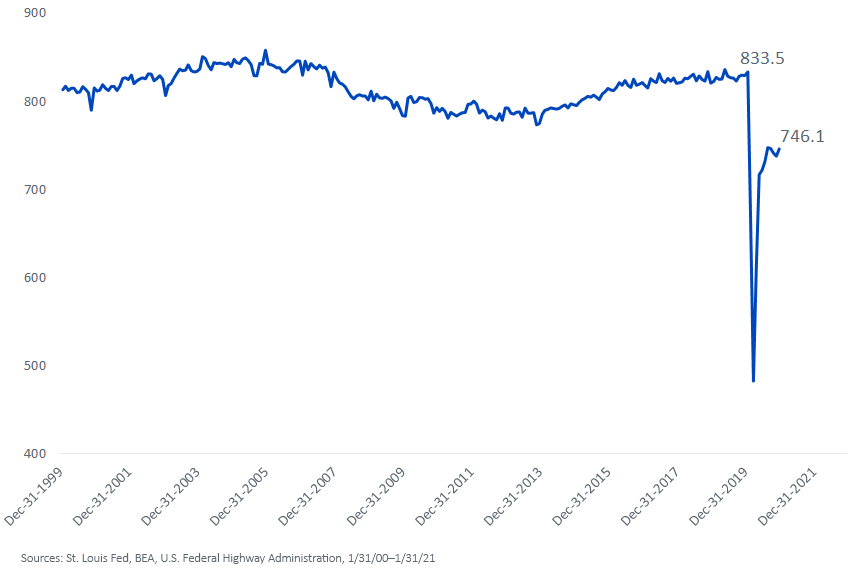
Though many of us are working from home—and thus logging zero commuting miles—just look at the action on the roads. If you are like me, you even caught a traffic jam or two in recent weeks. In January, the latest month for which we have data, the number of vehicle miles traveled was 54.6% higher than in April 2020, the most “ghost town” traffic month on record. In February, March, and April, the volumes were most certainly even higher.
Figure 1: U.S. Monthly Per Capita Vehicle Miles Driven
Stimulus money hit bank accounts in mid-March, so some of Americans’ new spending will show up in the Q1 GDP data. But another large chunk will come out of wallets in Q2, especially as it appears that herd immunity may be achieved by late spring or early summer.
Which brings me to the run-up to July 29, the day of the first estimate of Q2 GDP.
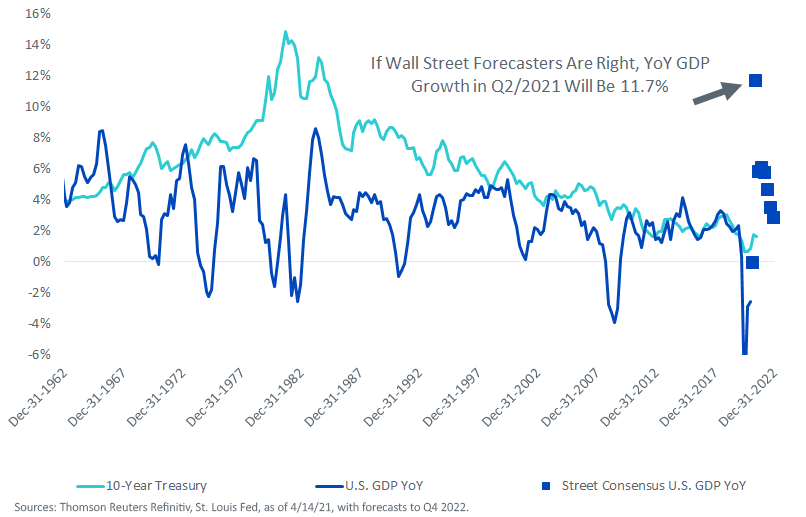
The Street consensus is for quarterly growth of 7.2% at a seasonally adjusted annual rate (SAAR)—a headier pace than the Q1 forecast of +4.8%. Should those growth rates come to fruition, that amounts to year-over-year GDP growth of 11.7%.
In figure 2, notice how the 10-Year Treasury yield has spent the years after the global financial crisis converging toward the real GDP growth rate.
Can the bond market let July 29 bring a double-digit year-over-year GDP jump without letting benchmark Treasuries drift up? Sure, it will be a fleetingly high GDP growth pace—one that will halve by Q3—but this still seems a risk to rate-sensitive equities.
Figure 2: 10-Year Treasury vs. U.S. GDP Growth
Which ones?
Rising rates disproportionately hit the net present value of business ventures with the most distant future cash flows. That describes many of the flashy “no profit now” companies that populate the Russell 2000 Growth Index. Even when you exclude the 43% of that Index’s total value that is comprised of companies with negative income, it still trades at a forward P/E ratio of 25.8. That strikes me as a recipe for trouble as July 29 approaches and those firms’ “out year” cash flows get discounted at ever-higher rates.
Figure 3 shows three WisdomTree strategies in U.S. small-cap, ranked along a return on equity (ROE)-based quality spectrum. They may be a way to get in front of an interest rate spike in reaction to or in anticipation of a red-hot Q2 GDP report.
Something to think about in the next traffic jam.
Figure 3: Small Caps Along a Quality Spectrum
For standardized performance of the Funds in the chart, please click their respective tickers: DES, EES, DGRS.
Disclaimer: Investors should carefully consider the investment objectives, risks, charges and expenses of the Funds before investing. U.S. investors only: To obtain a prospectus containing this ...
more

