
The Inverted Yield Curve: Be Greedy When Others Are Fearful
The yield curve got inverted on Wednesday, as the yield on the 10-year USTreasury fell below the yield on the 2-year note by a small margin. This triggered a massive selloff in the stock market and an explosion in investor fear.
Inversions in the yield curve have been reliable recession indicators in the past, but that does not necessarily mean that the US economy will necessarily enter a recession every time there is an inversion in the yield curve going forward.
Importantly, inversions are not a market timing indicator by any means. In fact, the historical data shows that stocks tend to perform mostly well in the first year and a half after a yield curve inversion.
The economic fundamentals are obviously very important, but markets are driven by the fundamentals in comparison to expectations. There is plenty of fear in the market right now, and a low bar is relatively easy to beat. For this reason, I wouldn't be surprised to see the economic data coming in better than expected over the middle term.
In any case, making investment decisions based on speculation about the future is hardly the best approach to risk management. As opposed to that, building a solid plan for all kinds of market environments is a much sounder strategy.
What The Yield Curve Inversion Really Means
An inversion of the yield curve is a reflecting concern about future economic growth, as investors are aggressively buying safe assets such as long-term Treasuries and pushing the yields of those bonds beyond shorter-term Treasury rates. Some observers also believe that an inverted curve signals that short-term rates are higher than they should be, and this tends to have a negative impact on economic growth.
Regardless of the reasons, the fact is that an inversion in the curve has generally preceded recessions over the past decades, so an inverted yield curve once again has produced plenty of fears among investors.
(Click on image to enlarge)
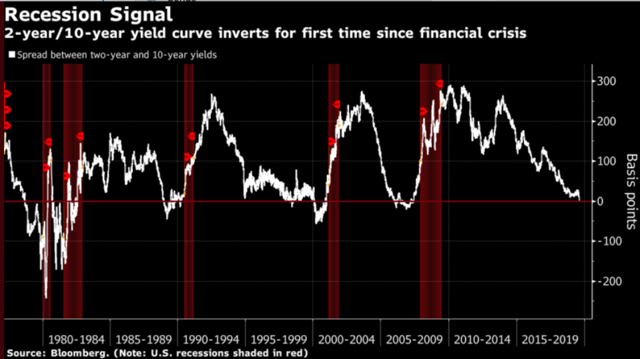
Source: Bloomberg.
On the other hand, the lead time between inversions and recessions is quite inconsistent and hard to predict. According to data from Credit Suisse, a recession is observed on average 22 months after the inversion.
Even more important, stocks tend to do well more often than not after inversions. On average, the market rallies more than 15% in the 18 months following the inversion, so an inversion is no market timing tool by any means.
(Click on image to enlarge)
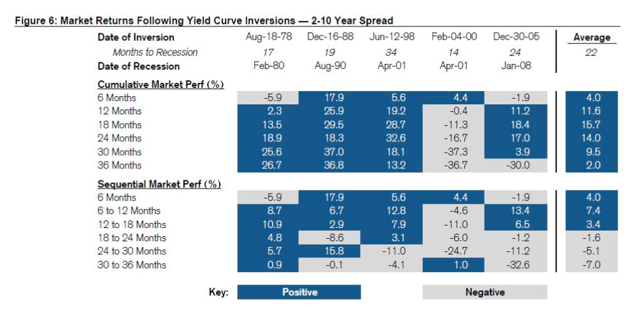
Source: CNBC
Looking at the evidence, inversions are important warning signals about the health of the economy, but selling stocks only because the curve has inverted does not make any sense from a historical and statistical perspective.
It Is All About Fundamentals Versus Expectations
There is a visible economic slowdown in different countries over recent months, and the trade war uncertainty is not helping at all. However, it's important to understand that stock prices don't reflect the fundamentals in isolation, but fundamentals in comparison to expectations are what really drives prices.
Even if economic growth remains sluggish, if the data comes in better than expected in the coming months, this could do a lot to alleviate economic concerns, most probably driving the stock market higher.
Interestingly, there is a divergence between economic data in the US and the 10-year yield lately. The chart below shows the Citigroup Economic Surprise Index in comparison to the 10-year yield. The two variables tend to move in the same direction over time since a weaker economy in comparison to expectations tends to press yields lower and vice-versa. However, in recent days, the economic surprise index has improved, while yields have remained subdued.
If this trend remains in place, economic data that is not as bad as previously feared could drive yields higher, and this would also be a tailwind for stocks in the most likely scenario.
(Click on image to enlarge)
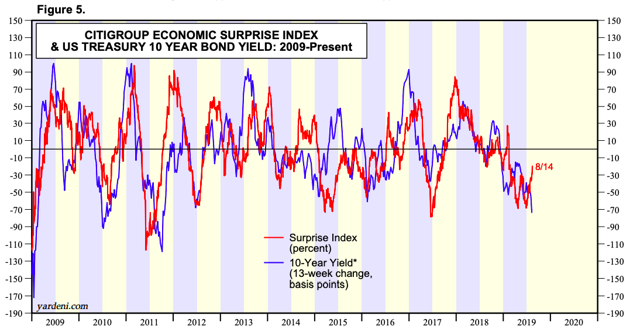
Source: Yardeni Research
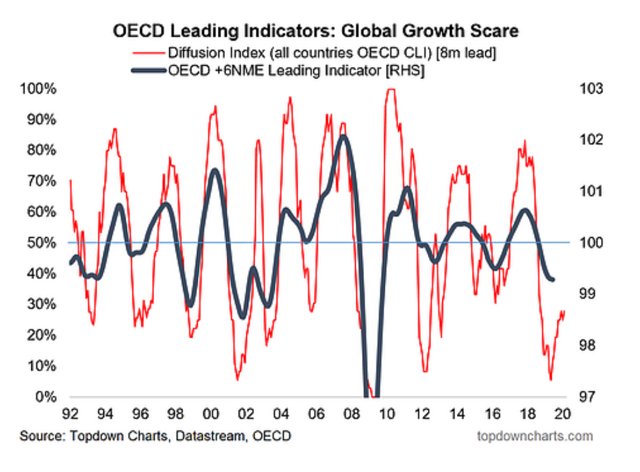
Offering a similar perspective, the OECD leading indicators are showing a light at the end of the tunnel, indicating that maybe the worse of the economic slowdown is already over.
(Click on image to enlarge)
The chart below shows the S&P 500 index in comparison to the percentage of respondents in the BofA Merrill Lynch fund managers' survey saying that they have taken out protection against a bear market. Most of the time when sentiment is as negative as it is right now, markets tend to do very well.
There are some exceptions to the rule, of course. In 2008, markets continued going down while sentiment was already quite negative. But the main point is that you need a big crisis for stocks to keep declining in the context of widespread negativity.
(Click on image to enlarge)
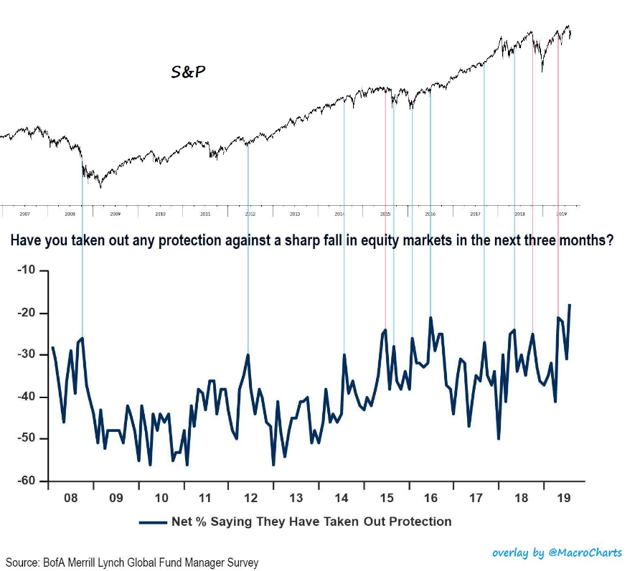
Source: MacroCharts
Moving Forward
I don't believe in being a perma-bull or a perma-bear. From my perspective, investors should always be willing to consider the bullish and bearish case for stocks in a particular point in time and implement portfolio protection measures when the downside risk is larger than the upside potential in the market.
On August 2, when the S&P 500 broke below key support levels around 2950 and the trade war was escalating, I decided to take some protective measures to reduce portfolio risk in my personal portfolio and in The Data-Driven Portfolio.
(Click on image to enlarge)
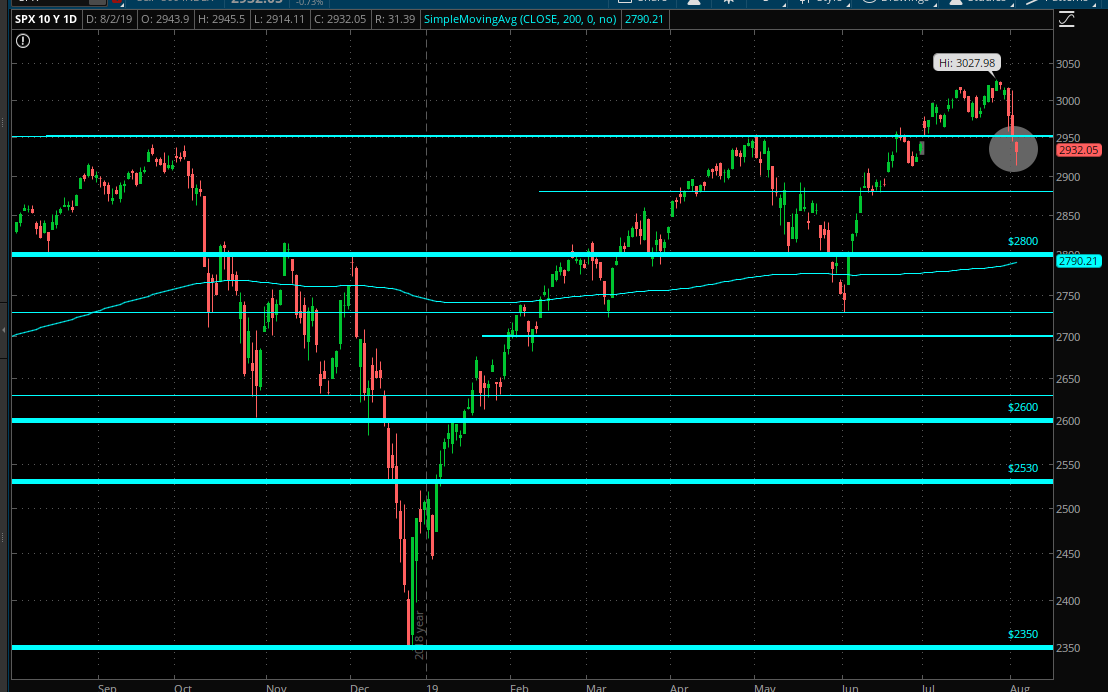
Source: Think or Swim
But then, I rapidly removed those protection measures as prices declined further and sentiment started reflecting a high probability of a recession on the horizon.
As of the time of this writing, The Data-Driven Portfolio, which I also replicate with my own personal money, is 40% in cash and 60% in stocks, which I consider a moderate level risk exposure. If markets keep coming down and the economic fundamentals remain not as bad as expected, I am considering the possibility of increasing portfolio exposure in the short term.
Successful investing is not about making bold economic forecasts, the key is always analyzing the hard evidence to optimize returns and control for downside risk over the long term. If the fundamentals turn for the worse and we see signs of a deep crisis in the global economy, then I may need to revisit this thesis and reduce portfolio risk again.
However, I would not be selling stocks only because the yield curve has inverted at this stage. This is already reflected on low market expectations, and when expectations are so low, it is relatively easy for markets to outperform those expectations. In the words of Warren Buffett, the time to be greedy is when others are fearful.
Disclaimer: I wrote this article myself, and it expresses my own opinions. I am not receiving compensation for it. I have no business relationship with any company whose stock is mentioned in ...
more

