
The Fed-Related Chart That Most Concerns The Stock Market
An ongoing debate rages about whether or how fast the Fed should hike rates in 2019. Some even question the need for a rate hike in December. Indeed, the market has priced in a “only” a 65% chance of a rate hike next month. I say only because before the October sell-off and November’s weakness, a December rate hike was treated like a 100% done deal. In fact, the odds for another rate hike in March, assuming 25 basis point moves, is well under 50%, currently at 35.9% (34.5% + 1.4%).
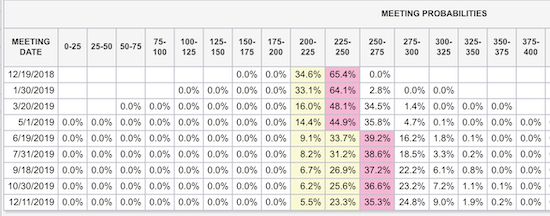
Source: CME Group FedWatch Tool
The market is pretty sure that the next rate hike will happen by January. The odds of the Fed taking a rest after that are pretty high.
President Trump raised the stakes with persistent complaints about what he sees as rates rising too fast. The Fed is in a no-win situation as a halt to rate hikes will either be interpreted as the Fed’s loss of independence and/or an acknowledgement that the economy is not quite as strong as the Fed has claimed. These dynamics are important because the history of rate hikes and recessions is pretty clear: recessions happen after the Fed drives rates to a high for the cycle. So they are either in the middle of a rate hike cycle or in the middle of a pause after driving rates to their high of the cycle. The 1990-91 recession is the one exception since 1967.
As the Fed focuses on hiking rates along with an improving employment picture in a battle against inflation or in an effort to stave off future inflationary pressures, the Fed invariably pushes the economy closer and closer to a slowdown. The chart below juxtaposes the effective Fed funds rate versus continued claims for unemployment insurance, a traditional measure of the health of the job market. Claims are currently at a 45-year low – an incredible feat given the expansion of the labor force since then – while the Fed funds rate is nowhere near even its pre-recession high.
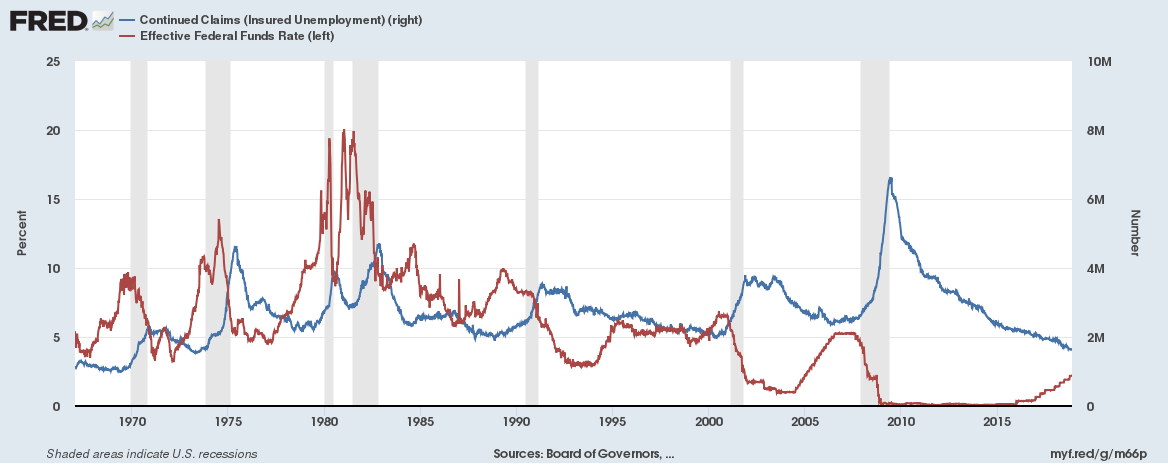
Source: U.S. Employment and Training Administration, Continued Claims (Insured Unemployment) [CCSA], retrieved from FRED, Federal Reserve Bank of St. Louis, November 17, 2018.
Continued claims on unemployment are on a 9-year downtrend that has slowed and steadied over the last 4 years. The Fed rate has hiked steadily for the last two. At some point soon, one, or both, trends have to come to an end. Continued claims are at a 45-year low.
Notice how the Fed tends to hike rates while continued claims are in decline or shortly after a period of decline. Next notice the location of recessions marked by the shaded areas. Recessions come close on the heels of a peak in rates. In the past, the market had to play guessing games as to whether the Fed had reached a peak in rates. These days the Fed tries to telegraph its path for rates as clearly as possible. So this time around, the market will likely feel a lot more confident in predicting a peak in rates. That estimate of a peak will start some kind of countdown to the start of the next recession. These conditions will put a tight cap on the stock market’s upside potential and will weigh the market with a lot more downside risk.
This is an incredibly hard trap for the Federal Reserve to manage. The Fed will have to message its decisions with utmost care and precision. The current stumbles in the stock market should raise alarm bells with the Fed even though the Fed would never admit to such concerns. In 2018, the S&P 500 (SPY) has stumbled after every Fed rate hike and after almost every other Fed meeting. Going forward, these reactions and their durability will get ever more critical in interpreting the market’s sentiment towards the future.
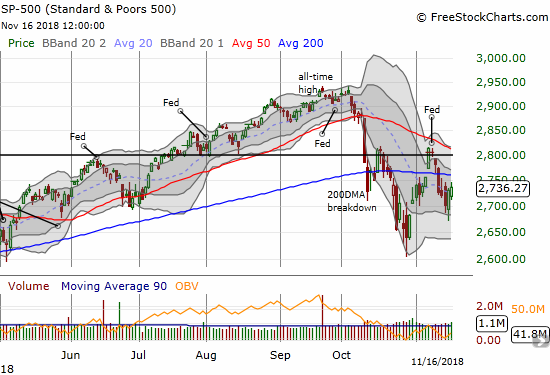
Source: FreeStockCharts.com
The S&P 500 (SPY) has spent the majority of the last five weeks below its 50 and 200-day moving averages (DMA). The stock market last suffered this kind of technical damage during August, 2015 to April, 2016.
Disclosure: Full disclosure: long SPY calls and SSO shares
Follow Dr. Duru’s commentary on financial markets via more


