
The Correction Continues
First, the good news.
Despite all of the volatility over the last two months, a seemingly brutal quarter for investors came to an end with a staggering loss on the S&P 500 of -1.22% or about -0.76% including dividends.
I know, it’s horrible. After all, the S&P 500 just broke a 9-quarter straight winning streak which was one of the longest in history. For some perspective, the chart below shows the quarterly performance from 2015 to present.
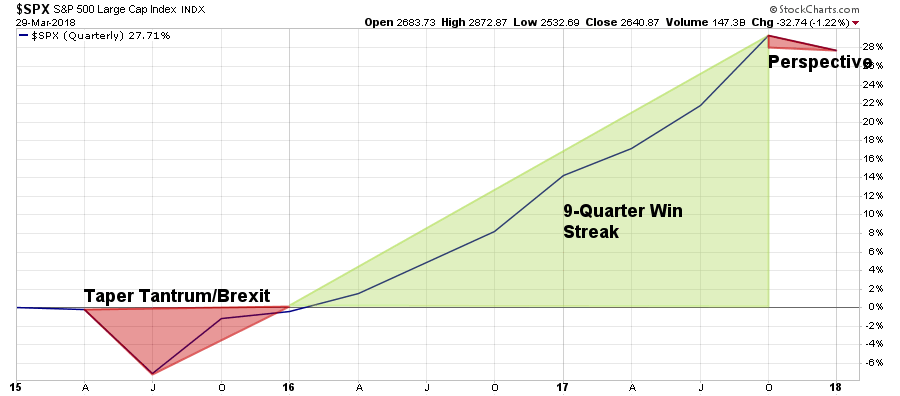
When you look at it this way, there doesn’t seem much to worry about.
However, as I have been discussing over the last two months, once you zoom into the ongoing consolidation process the picture changes more dramatically.As I noted on Tuesday:
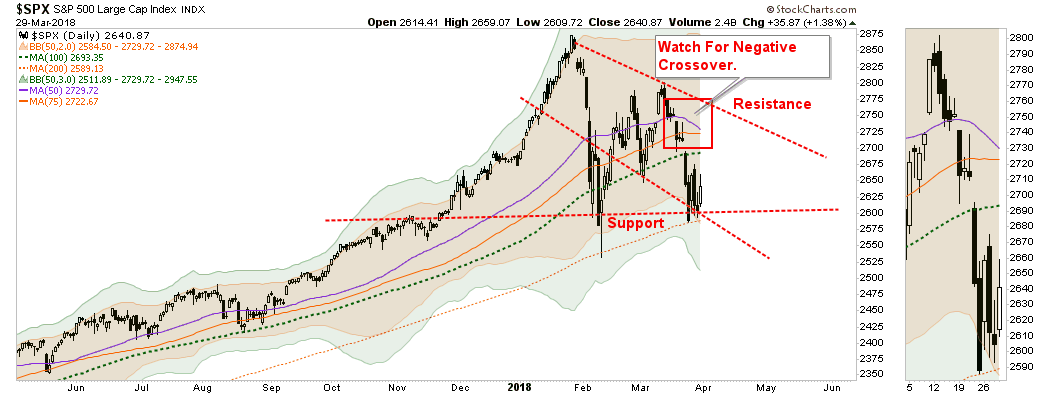
“With the market oversold, we are looking for a rally to the 100-dma to further rebalance portfolio risks. (We have been doing this already over the last several weeks and have been underweight equity and overweight cash.)”
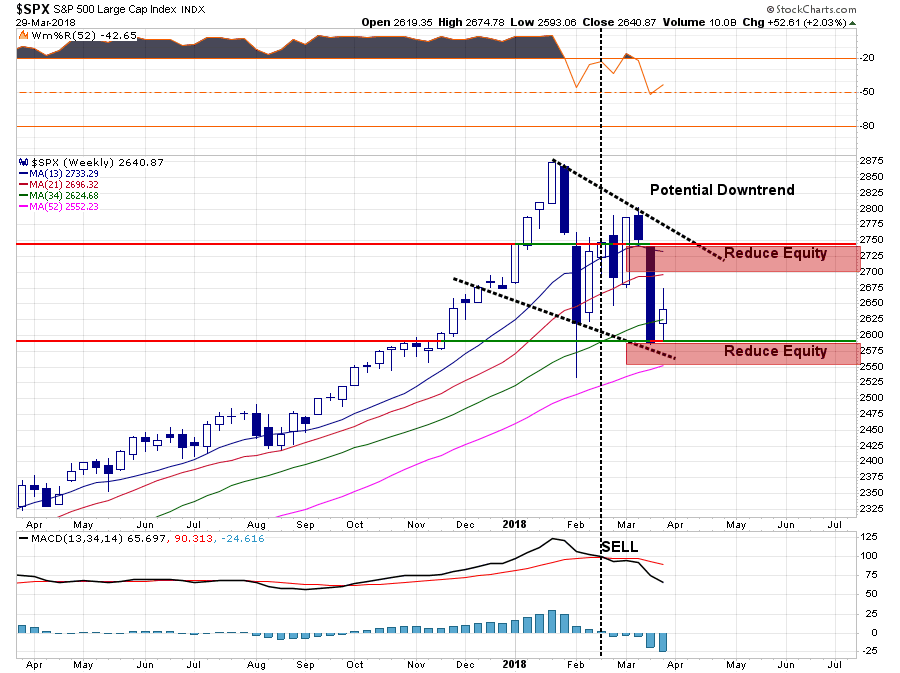
Chart updated through Thursday’s close:

“However, my guess is we are not likely done with this correctionary process as of yet.”
It is this pickup in volatility where the majority of emotional, or behavioral, mistakes are made.
From a very short-term perspective the backdrop has improved to support a continued reflexive rally next week:
- The market remains oversold providing fuel for a relief rally.
- Option 1, noted above, continues to be the preferred path for a rally back to the 100-dma.
- Double bottom support at the 200-dma provides a bullish backdrop for investors.
With this setup, the possibility of more constructive action next week has risen.
Of course, there are a lot of things that could go wrong as well, so having a plan remains key.
While we had reduced allocations to basic materials, industrials, international and emerging markets a few weeks ago, when the current Administration launched their “tariff” related plans,we also have removed our “short hedges” for the time being to allow for this reflexive rally to occur.
Given the more constructive backdrop, we are maintaining the balance of our equity exposure for now and have NOT reduced allocations to the new adjusted target levels as of yet. As discussed last week:
“This week, the markets broke on several fronts which have triggered confirmed ‘sell signals’ on several levels requiring a reduction in equity risk exposure. In accordance with the model adjustments above, begin reducing portfolio equity weighting by 25% on any failed rally attempts.”
“IMPORTANTLY – this does NOT mean go ‘sell’ everything Monday morning. As noted above in the main analysis, we are slightly reducing equity exposure on a rally to hedge risks of a further decline until the current volatility phase passes.
Importantly, as always, portfolio management is about making SMALL adjustments as evidence presents itself and should never be perceived as an ‘all or nothing’ issue. “
We have NOT made that adjustment yet as our target levels for a retracement have not been fulfilled, nor has support been broken.
An occurrence of either event, as shown below, will lead to further reductions in portfolio “risk.”
Is A Bear Emerging?
The bigger question, however, is whether, or not, the 9-year old bull market is coming to an end?
Let me clarify something first.
I am neither bullish or bearish. I just look at the markets a “tad” differently than most.
While portfolios allocations remain “nearly” fully invested, (we are carrying about 12% cash currently,) the longer-term market trend remains clearly upward which keeps us more allocated to equities currently.
Here is the important point.
When portfolios are allocated to the markets, and the markets are rising, I am not really concerned about finding reasons why the market will “continue to go up.”
My bigger concern, as it both destroys capital and impairs performance, is what are the risks of a sudden and unanticipated correction. Kind of like the one we are experiencing now.
When the next major correction occurs, my focus will change on what could “end” the bear market and cause the markets to rise.
The goal of investing for the long-term, after all, is to “buy low and sell high,” not vice-versa.
“If you only focus on the half of the full-market cycle you want, you will miss the signs warning you of the half you don’t.”
For me, a “bear market” is not a correction of 20%, or worse, but rather a period of time where the risk to capital is substantially greater than reward. In my view, a correctional process that spans several months with substantially higher volatility and capital risk is qualifying of the “bear market” label. Waiting until you have a 20% decline before deciding to take action is really rather pointless.
So, what about the question at hand? Is a bear market emerging?
On several different levels, there is substantial evidence mounting that continues to support that case.
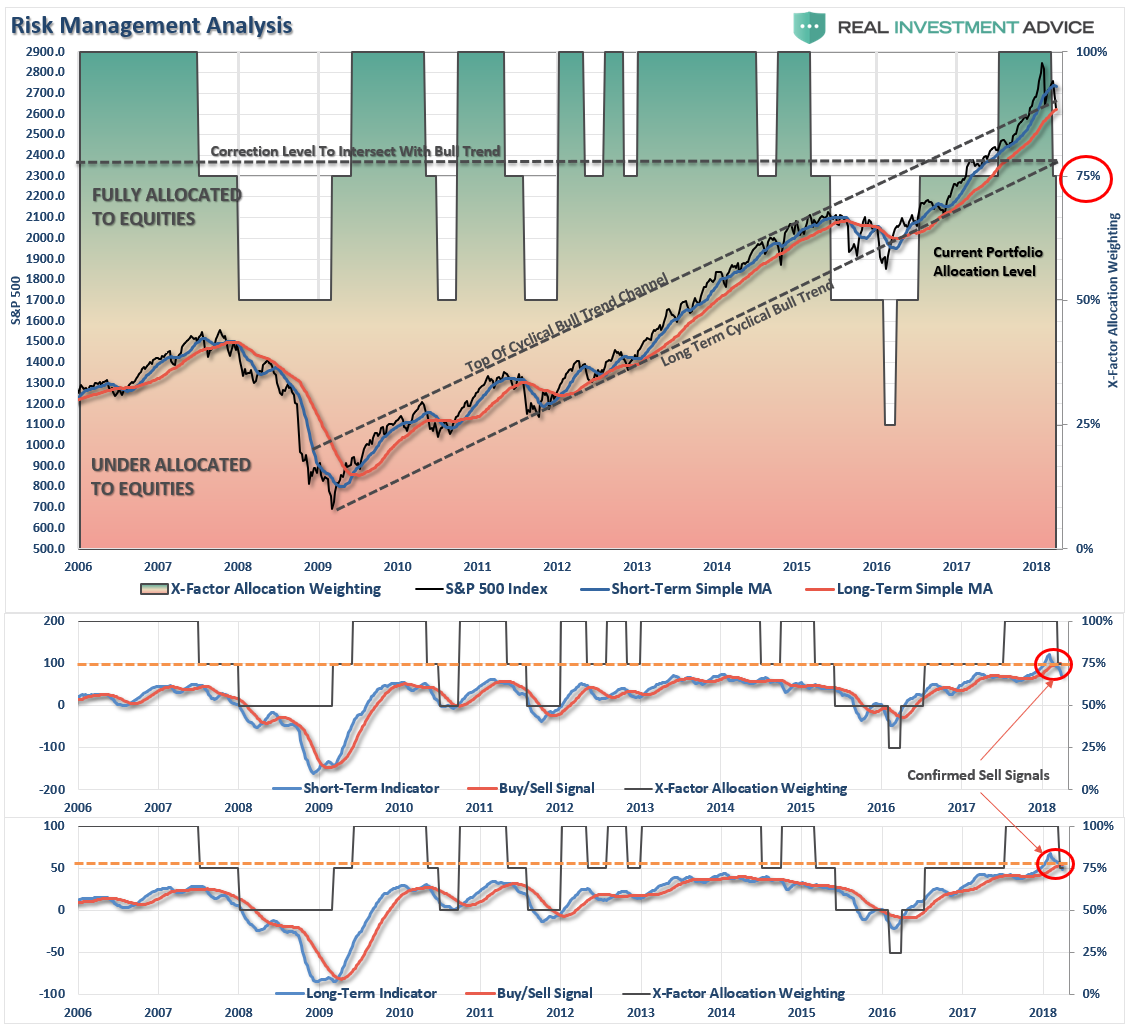
First, let’s update our weekly chart and buy/sell signals from last week.
Despite the 2.03% gains for the week on the S&P 500, the convergence of the previous bullish trend lines remains formidable resistance to a further rally.
Furthermore, the confirmed “sell signals” remain firmly intact and currently suggest further downward pressure on prices for now.
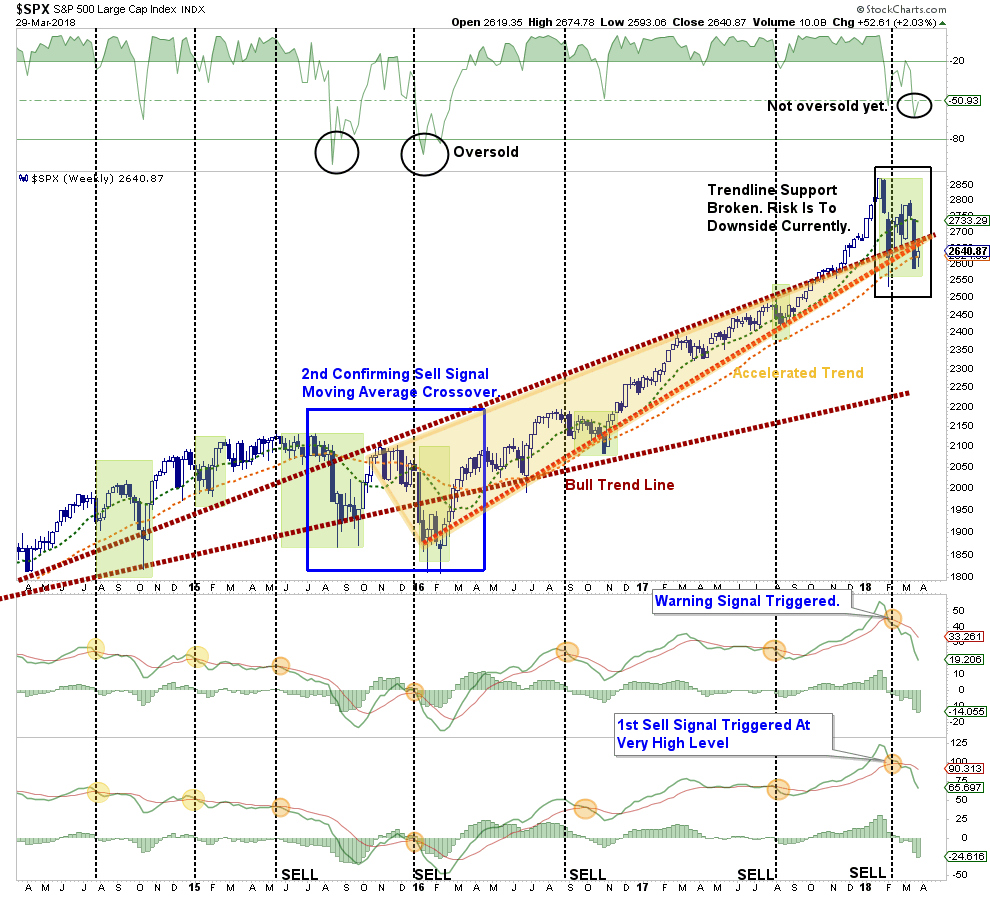
Notice in the chart above the similarities between the current correction and that of the correction process that began in mid-2015 through early 2016. As was the case then, the correction started with a sharp sell-off, was followed by a rally which failed to set new highs, and took the market back to extreme overbought conditions, and then collapsed to new lows before Central Banks took aggressive action to stem the selling.
Currently, the correction process is running very similarly. However, before you jump on the “second bottom was the bottom” scenario there are several differences to pay attention to this time.
- In 2016, the Fed has just “started” embarking on their monetary policy tightening and there was a tremendous amount of liquidity sloshing around the market.
- Furthermore, the Fed was still reinvesting their balance sheet, which continued to add liquidity to the market, versus contracting their balance sheet as they are currently.
- Central Banks globally were also fully engaged in Q.E. but are currently now contracting those programs.
- From a technical basis, the previous “sell signals” at the second bottom, were at extremely low levels versus still at extremely high levels as they are today.
- Also, the market was deeply oversold on a technical level in terms of both RSI and deviations below the intermediate-term average which is not the case currently.
I could go on…but you get the point.
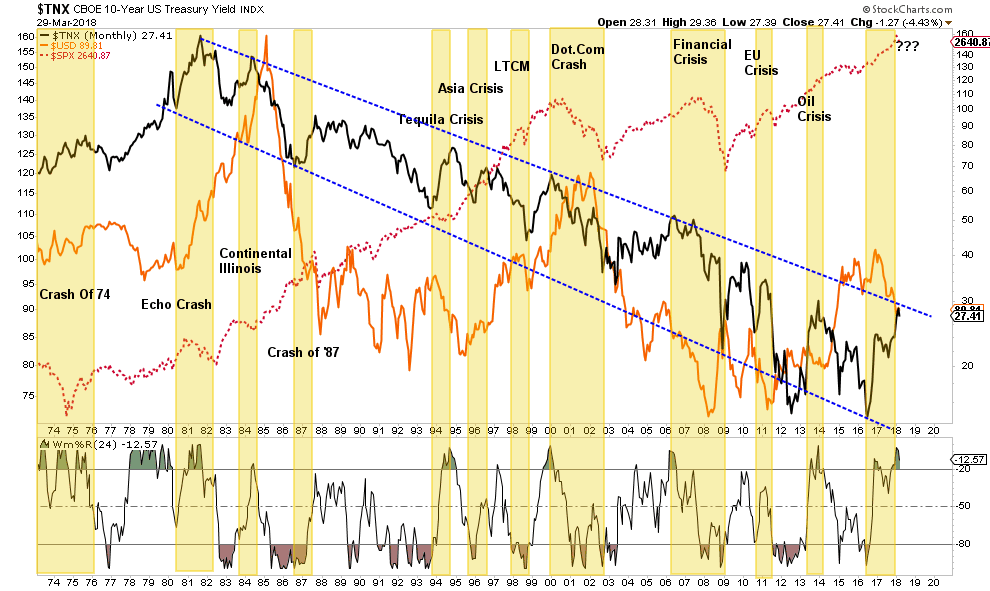
Secondly, the bond market may already be signaling a more important shift. The breakout on bonds suggests a rotation for “risk” to “safety” is already underway. Historically speaking, and as shown below, such shifts from extreme oversold conditions on bonds has tended to be linked with more important market events.
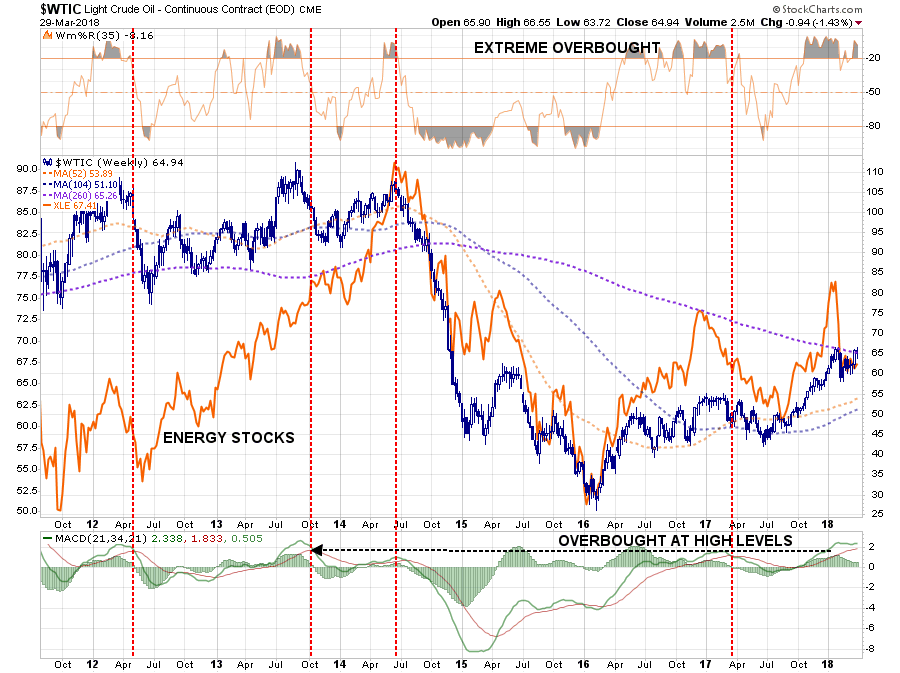
Third, oil prices, which negatively impact consumer spending have risen sharply since the middle of last year. That rise, which has been a primary driver of the “inflation” story, has likely come to an end as crude inventories continue to build against a backdrop of weaker global demand going forward. A break below $60/bbl will likely see a retracement back towards $50 and will also detract from both the“earnings growth” and “stronger economy” stories.
Fourth, and as pointed out by Decision Point recently, there have only been a few occasions throughout history where prices have been as detached from “expensive levels” as they are now. Those corrections have tended to rather damaging to investors. As Erin Swenlin noted:
“Finally, let’s address the idea that the market is fundamentally sound. The chart below shows that the market is grossly overvalued. This is not a timing tool, but it is a bright red warning light.”

Lastly, with the market oversold on a short-term basis, a rally, as stated, is very likely. However, moving averages are beginning to flatten out and/or turn down. Crosses of the short and intermediate term moving averages have historically been linked with deeper corrections and bear markets.
As I noted last week:
“With the market currently overextended, overbought, and overvalued against a backdrop of negative underpinnings, the longer-term bearish case should not be ignored.”
Such remains the case this week as well.
Is a “bear market” emerging? There is absolutely a case that one could be and the outcomes of such are not palatable to long-term financial goals. As Nicholas Colas penned last week (courtesy of Zerohedge)
“We should emphasize that none of these scenarios are anything close to our base case. The purpose of this exercise is to consider what levels on the S&P 500 correspond to historically valid and profitable entry points. To sum up our levels:
- Market crash scenario: buy the S&P at 2187, down 16% from today.
- Protracted bear/revaluation market: buy the S&P at 1646, down 37% from today.
- Recession scare: buy the S&P anywhere from 1776 to 2023, down 22-32% from today.”
While I don’t disagree with his “math", here is what I can visualize from a technical retracement perspective.
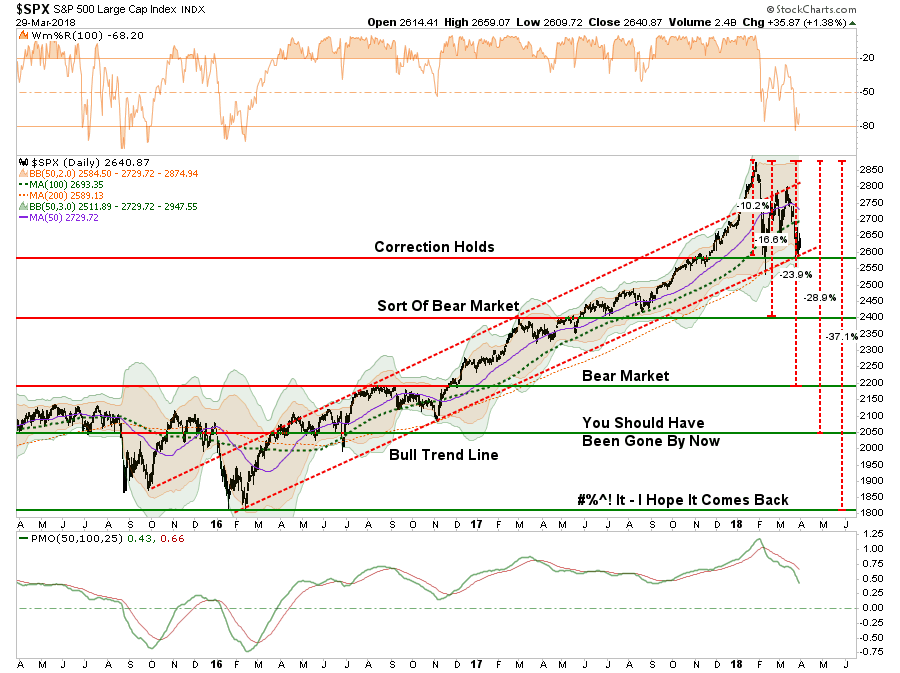
The key levels from a price perspective are as follows:
- 2600 – Market holds at current correction levels and resumes bullish trend (optimistic)
- 2400 – Good support lies at 2400 but a 16% correction is painful. Long-term bullish trends remain intact.
- 2200 – Strong support from previous correction breakout. Official “bear market” with near 24% decline.
- 2050 – Economy likely in a recession at this point. Bear market grows with a 29% decline
- 1800 – There is likely a lot going wrong at this juncture and a 37% decline has destroyed most portfolios.
The important lesson here is not to debate on why the bull market will likely resume. Such could very well be the outcome particularly if global Central Banks leap back into action. The lesson is to understand the varying degrees of portfolio risk and have a plan to react if things go wrong.
As I noted last week, missing out on a rally in the market is extremely easy to make up. Recouping lost capital is an entirely different matter.
Let’s see what happens next week.
A Discussion On Gold vs Coins With Kevin DeMeritt
With the recent turmoil in the markets, and passage of the “unending spending bill” by Congress, it is not surprising I have gotten a tremendous number of emails from readers wanting to know my opinion on owning “physical” gold.
As you know I am NOT a huge “gold bug” and I look at precious metals as a trading position in portfolios. However, I will not argue the point that there are definitely reasons to own precious metals as a portion of your overall portfolio.
But what should you buy? Bullion or Coins?
Since this is not my area of expertise, I figured the best thing to do would be to contact an expert on the issue to get you the information you need. I hope you find the following interview with Kevin DeMeritt of Lear Capital helpful in your research.
Market & Sector Analysis
Data Analysis Of The Market & Sectors For Traders
S&P 500 Tear Sheet
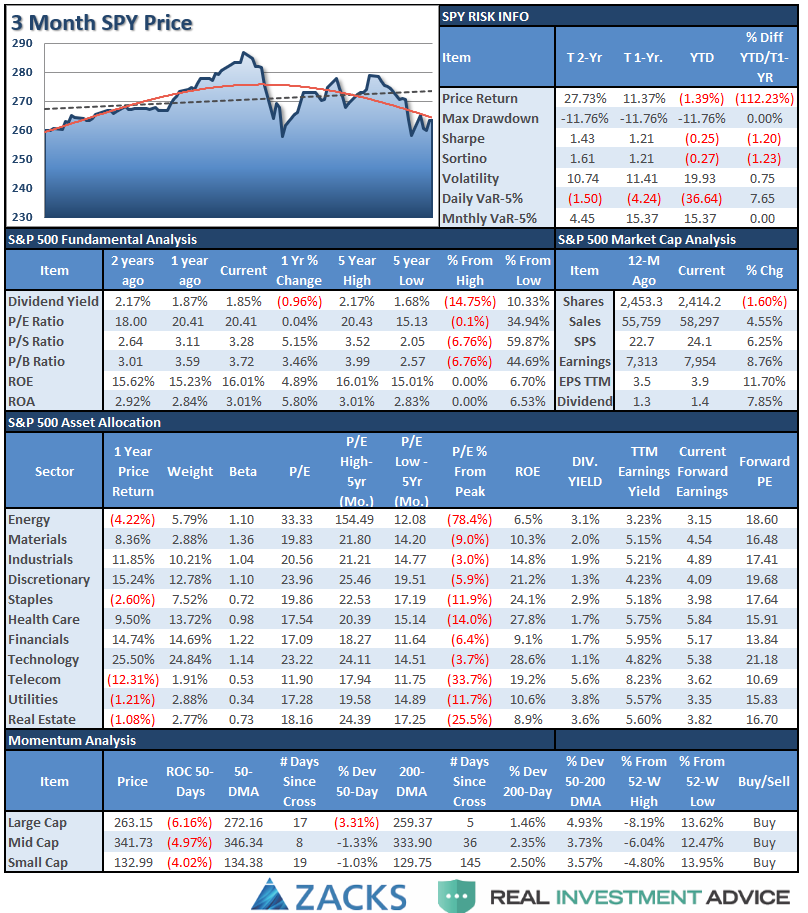
Performance Analysis

ETF Model Relative Performance Analysis
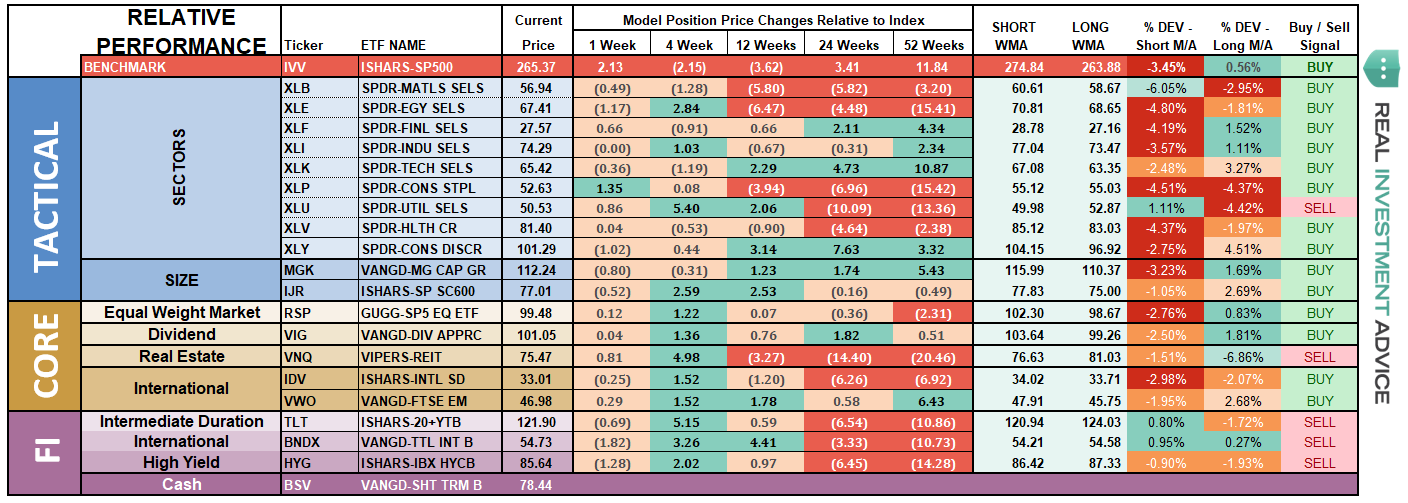
Sector & Market Analysis:
With the “sell signal” firmly in place on a short-term basis, the selling pressure has continued to suppress a rally in the market. Despite a rally last week, as we will discuss, there is little that has markedly improved since last week.
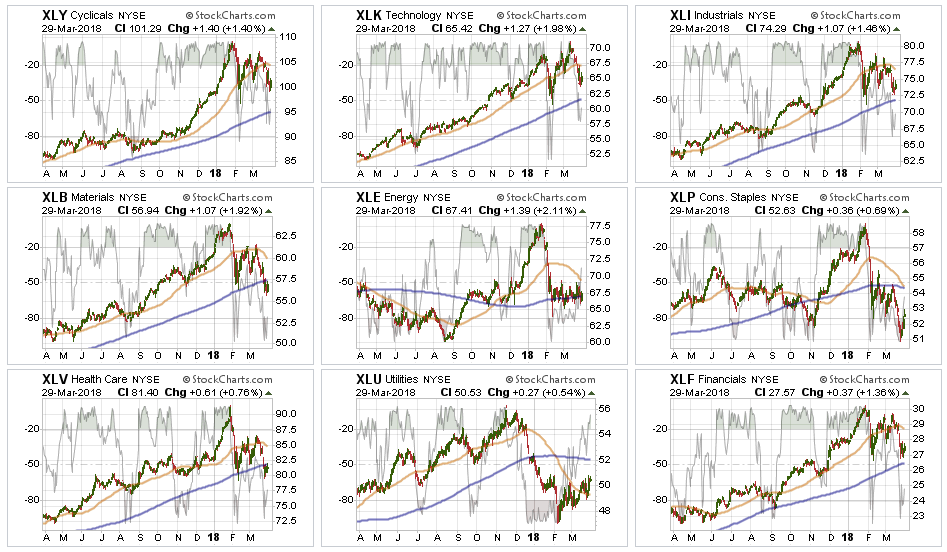
Discretionary, Technology, Industrials, and Financials - All of these sectors have continued to remain below their respective 50-dma’s. But importantly, despite the drubbing of Facebook and Amazon last week, Technology as whole remained supportive of the overall bullish trend. Furthermore, these sectors, while improving, are NOT oversold currently which provides enough room for a test of their respective 200-dma’s over the next couple of weeks. As I noted last week, it is a reasonable idea to take profits and reduce weightings accordingly.
Health Care, Materials, and Energy – We were stopped out of our small additional Energy trade with the previous break below the 200-dma, and continue to recommend under-weighting the sector for now. The push higher in oil prices is likely not sustainable and energy stock prices are likely reflecting the same. We also closed out our Materials and Industrials trade on “tariff” risks. Health Care has now also broken the 200-dma suggesting reducing weights there as well.
Staples – our stop level was triggered on Staples and we will be eliminating exposure to the sector on this rally. The sector is dangerously close to a moving average crossover which could pressure prices lower. Utilities have continued to under-perform in recent weeks, but have been improving as of late with a break back above the 50-dma. We are not recommending adding to the position yet, but we are watching to see what happens next. Stops are set at recent lows.
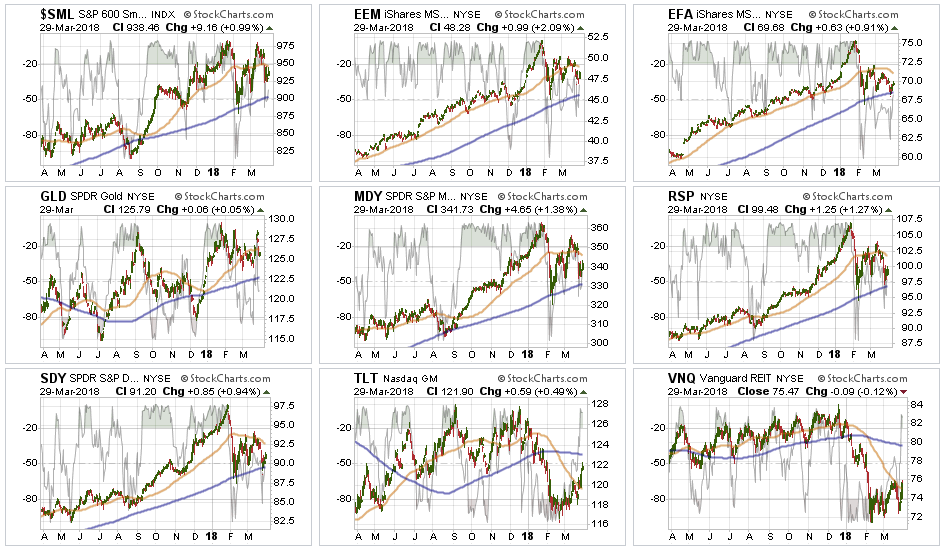
Small Cap, Mid Cap, Emerging Markets, International, Equal Weight, and Dividend indices all broke back down through their 50-dma with international stocks testing its 200-dma. Two weeks ago, we removed international and emerging market exposure due to the likely impact to economic growth from “tariffs” on those markets. That reduction helped hedge risk this past week. Dividends and Equal weight continue to hold their 200-dma and performed better than the S&P index as a whole as money rotated to Utilities in the “flight to safety” rotation.
Gold continues its volatile back-and-forth trade but remains confined to a downtrend currently. As of this past week, Gold is once again testing recent highs which IF gold can break out of this consolidation would be very bullish. We currently do not have exposure to gold, but if you are already long the metal, we previously recommended that while the backdrop overall remains bullish, the correctional phase continues so taking profits on rallies remains prudent.
Bonds and REITs - Over the last couple of weeks, these two sectors looked to have bottomed and initiated early “buy” signals. Hold positions for now as interest rates have started to recognize the economic weakness that has shown up in the data as of late.
Sector Recommendations:
The table below shows thoughts on specific actions related to the current market environment.
(These are not recommendations or solicitations to take any action. This is for informational purposes only related to market extremes and contrarian positioning within portfolios. Use at your own risk and peril.)

Portfolio/Client Update:
As I addressed at length this week, I still suspect an oversold rally to ensue over the next week or two. While we want to honor the current “bullish trend", we are also well aware of the rising risks and still, for now, believe it is prudent to reduce equity-related risk on this rally.
If we reduce equity allocations, and the market repairs all of the technical damage and re-establishes the previous bullish trend, we will reallocate accordingly and increase equity exposure back to target levels. Our bigger concern, currently, remains the relative risk to capital if the 9-year old bull market begins a more meaningful correction process. As I noted, there is plenty of evidence to support the latter case.
With the rally this past week, we are going to give the market a bit more “running room” this coming week. As always, we prefer the market to “tell us” what it wants to do versus us “guessing” at it. “Guessing” generally never works out as well as planned.
It is crucially important the market maintains support at current levels and continues to rally next week. After having reduced exposure to “tariff” related areas a couple of weeks ago (materials, emerging and international markets), we will use any rally in the next week or so to further reduce equity risk exposure in portfolios. We will also look to add additional hedges to the portfolio on any rally that fails at overhead resistance.
We remain keenly aware of the intermediate “sell signal“ which has now been “confirmed” by the recent market breakdown. We will continue to take actions to hedge risks and protect capital until those signals are reversed.
THE REAL 401k PLAN MANAGER
The Real 401k Plan Manager – A Conservative Strategy For Long-Term Investors
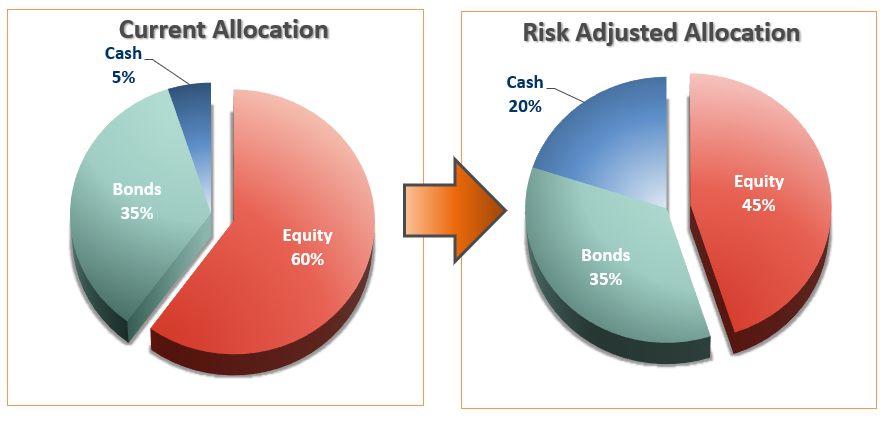
There are 4-steps to allocation changes based on 25% reduction increments. As noted in the chart above a 100% allocation level is equal to 60% stocks. I never advocate being 100% out of the market as it is far too difficult to reverse course when the market changes from a negative to a positive trend. Emotions keep us from taking the correct action.

Patience
As I noted last week:
“This week, the markets broke on several fronts which have triggered confirmed ‘sell signals’ on several levels requiring a reduction to equity risk exposure. In accordance with the model adjustments above, begin reducing portfolio equity weighting by 25% on any failed rally attempts.”

With the market trying to muster a reflexive rally, be patient and allow the oversold conditions of the market provide a better opportunity to rebalance portfolio risks.
We have been suggesting over the last couple of the months to rebalance bond holdings back to target levels as a hedge against volatility which has worked well over the last couple of weeks. For now, maintain current allocations but have a plan in place to reduce risk on a further rally.
Importantly, as always, portfolio management is about making SMALL adjustments as evidence presents itself and should never be perceived as an “all or nothing” issue.
The model below is just a “sample” allocation. Feel free to adjust the weights according to your own age, risk tolerance and goals.
Importantly, while the market remains “bullishly biased” in the short-term, the longer-term picture of increased volatility, low-forward returns and capital destruction risks still prevail. If you are near retirement, moderate your allocation accordingly to reduce the risk of loss.
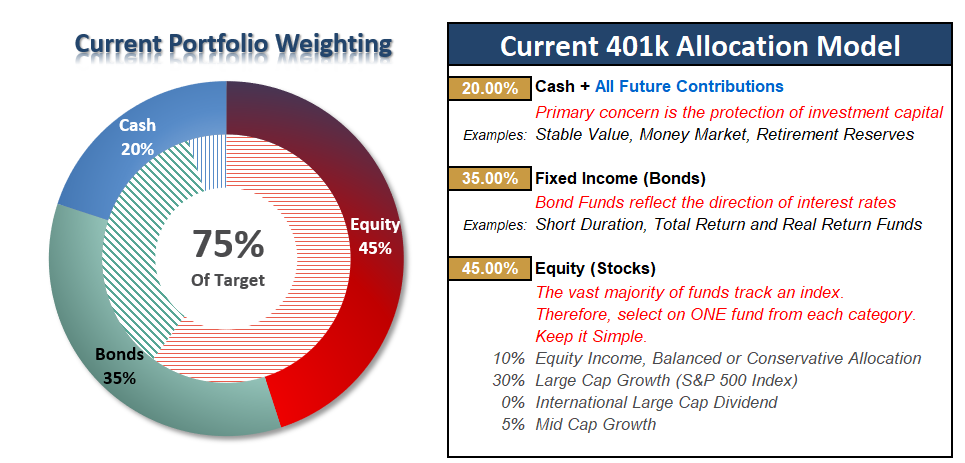
Current 401-k Allocation Model
The 401k plan allocation plan below follows the K.I.S.S. principle. By keeping the allocation extremely simplified it allows for better control of the allocation and a closer tracking to the benchmark objective over time. (If you want to make it more complicated you can, however, statistics show that simply adding more funds does not increase performance to any great degree.)
401k Choice Matching List
The list below shows sample 401k plan funds for each major category. In reality, the majority of funds all track their indices fairly closely. Therefore, if you don’t see your exact fund listed, look for a fund that is similar in nature.

Disclosure: The information contained in this article should not be construed as financial or investment advice on any subject matter. Real Investment Advice is expressly disclaims all liability in ...
more

