
The 2s10s Just Inverted: Here's What Happens Next
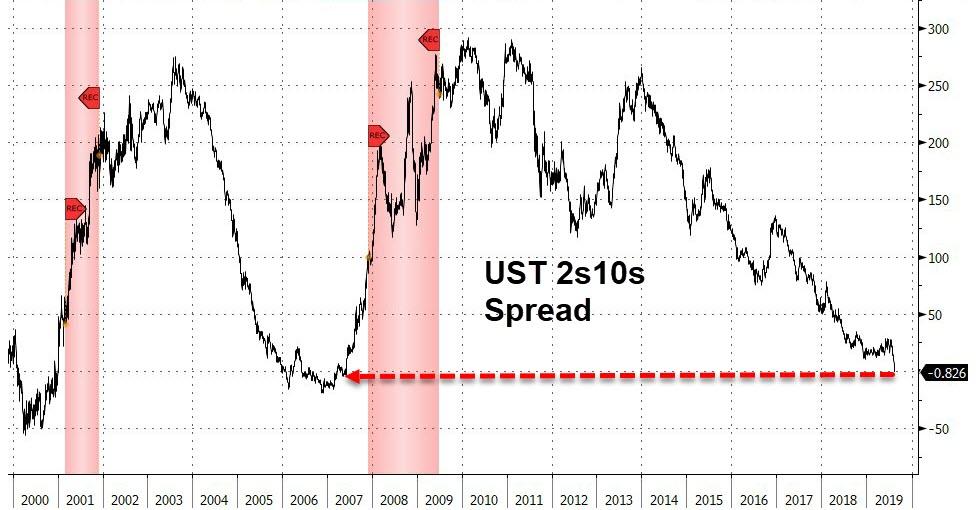
It's official: after 12 years - the longest artificial, central-bank propped expansion on record - the business cycle is once again officially in its death throes, and this morning the 2s10s Treasury yield curve inverted for the first time since May 2007.
(Click on image to enlarge)
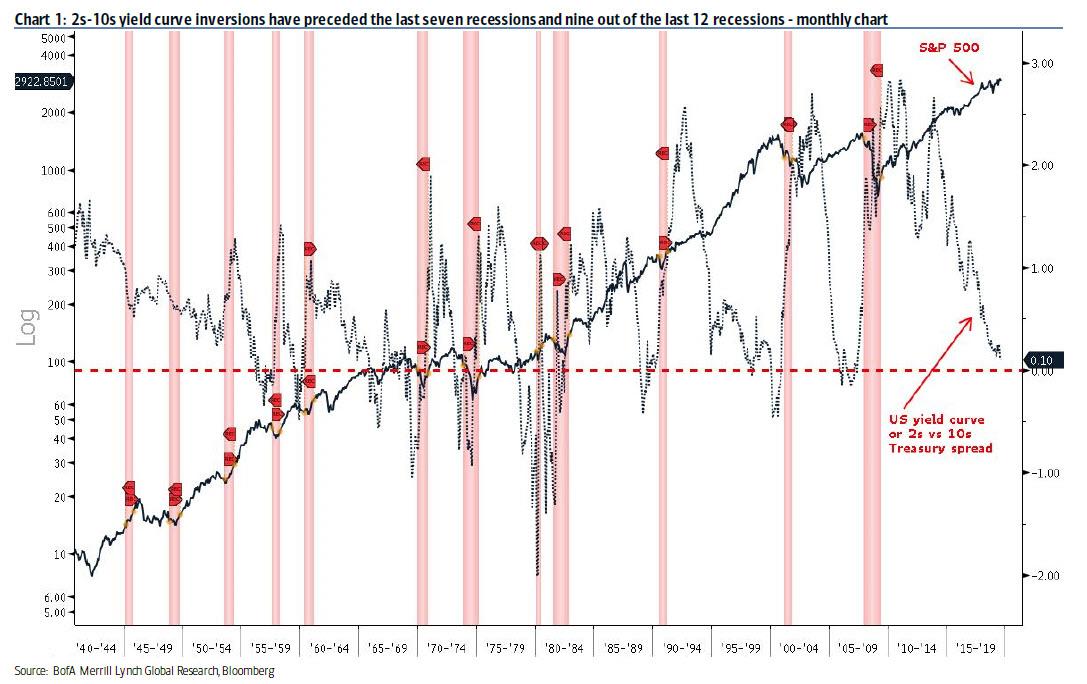
So why is the market freaking out? Because of all economic indicators, this one is, without doubt, the most foreboding and ominous. Consider that 2s-10s yield curve inversions have preceded the last seven recessions and nine out of the last 12 recessions. In fact, as Bank of America points out, there was one yield curve inversion in the mid-1960s that did not precede a recession and the yield curve did not invert ahead of the three recessions between the mid-1940s and early 1950s. However, in the past 5 decades, a 2s10s inversion has been a guaranteed signal that a recession is imminent.
(Click on image to enlarge)
So when should one expect the recession to arrive? Going back to 1956 it has taken between eight (1959) and 24 months (1967) for a US recession to start after a yield curve inversion. The average and median length of time from inversion to the start of a recession are 15.1 and 16.3 months, respectively. It took a year or more for a recession to begin after six out the ten inversions (1956, 1967, 1978, 1989, 2000, and 2005).
(Click on image to enlarge)
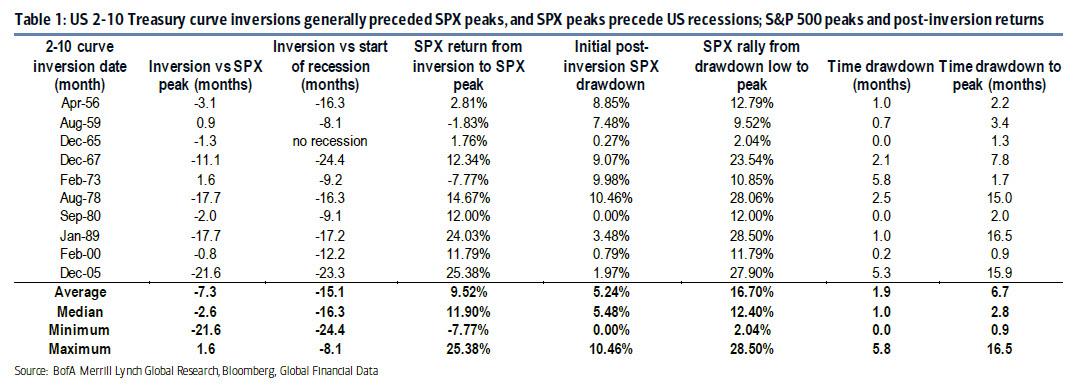
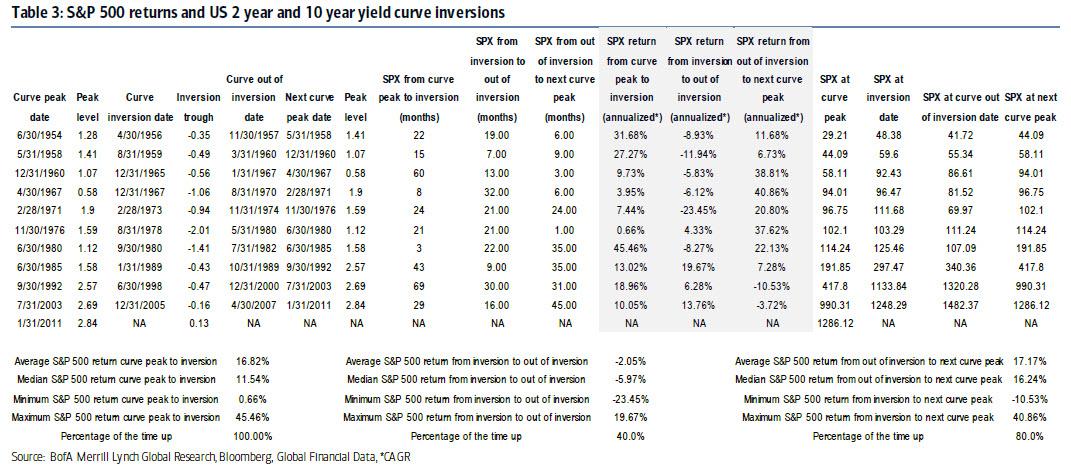
But while a recession may now be just a matter of time, the bigger question for traders is what happens to the stock market next? According to an analysis from Bank of America, while much of the time the S&P 500 peaks within two to three months of a 2s10s yield curve inversion but it can take one to two years for an S&P 500 peak after an inversion.
For the ten yield curve inversions back to 1956, the S&P 500 topped out within approximately three months of the inversion six times (1956, 1959, 1965, 1973, 1980, and 2000). However, the S&P 500 took 11 to 22 months to peak after the other four inversions (1967, 1978, 1989, and 2005).
On an average basis, the S&P 500 tends to peak 7.3 months (average) or 2.6 months (median) after a 2s10s yield curve inversion. The range of S&P 500 peaks is from 1.6 months (1973) to 21.6 months (2005) after the inversion – a wide range.
In short, as BofA gloomily summarizes, the US equity market is on borrowed time after the yield curve inverts. There is a silver lining: after an initial post-inversion dip, the S&P 500 can rally meaningfully prior to a bigger US recession-related drawdown. Think of it as the market's "last gasp" rally.
Here are the details: The initial post-inversion drawdown is 5.2% on average (5.5% median) but has ranged from 0% (1980) to 10.5% (1978). These drawdowns typically last one to two months but have ranged from 0 (1980) to 5.8 months (1973).
After the initial drawdown, the S&P 500 can have a meaningful last gasp rally. This rally has averaged 16.7% (12.4% median) with a range of 2.0% (1965) to 28.5% (1989) and lasts 6.7 months on average (2.8 median) with a range of 0.9 to 16.5 months. The 1967, 1978, 1989, and 2005 inversions saw last gasp rallies in excess of 20% on the S&P 500.
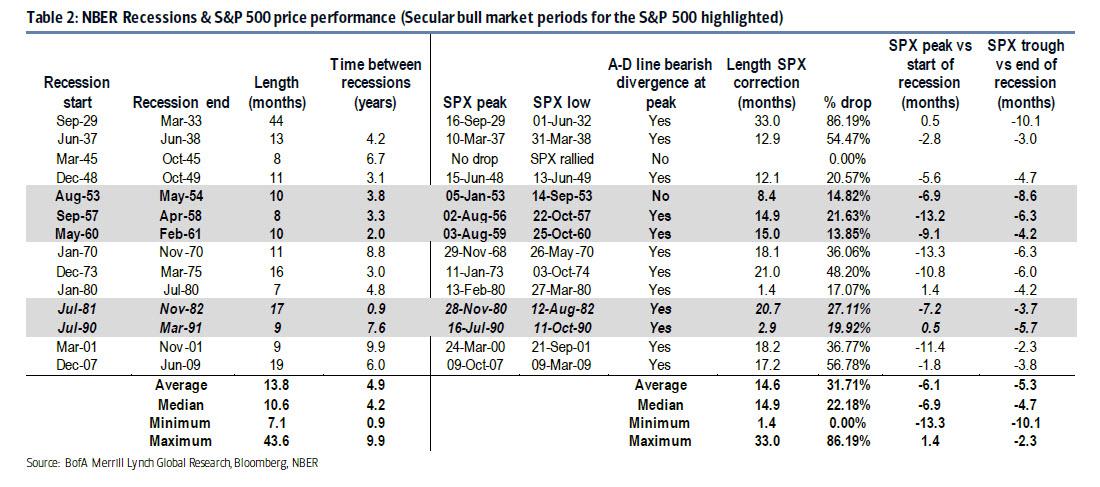
In other words, the typical pattern is the yield curve inverts, the S&P 500 tops sometime after the curve inverts (see above) and the US economy goes into recession six to seven months after the S&P 500 peaks. The S&P 500 tends to be a leading indicator of US recessions but market peaks occurred just after the three recessions beginning in 1929 (Great Depression), 1980, and 1990. The S&P 500 leads at the end of recessions and tends to bottom out five months prior to the end of a US recession. The S&P 500 has never bottomed after any of the 14 recessions going back to 1929.
Ok, so, a recession is coming. What will that look like and how will the market perform? According to BofA, S&P 500 corrections associated with NBER recessions average 31.7% (22.2% median) and lasts 14-15 months (range of 1.4 to 33.0 months.
There is a silver lining here, too, in that S&P correction are less severe during secular bull markets. The 1950-1966 bull market had three and the 1980-2000 bull market had two. The S&P 500 pullbacks associated with recessions during secular bull trends are much less severe and averaged 20% (range of 13.9% to 27.1%) rather than the average 40% drawdown (range of 0.0% to 86.2%) for recession pullbacks during secular bear phases.
In other words, expect the bullish pundits to hit the financial TV circuit next, preaching that this is nothing more than a garden variety mini-recession in a long-term secular bull market. The reality, of course, is that if central banks have indeed lost control, this will be the worst bear market in history.
(Click on image to enlarge)
Looking at the 2s10s spread itself, it follows a cycle of 1) peaking and flattening to inversion, 2) spending time inverted and 3) steepening out of inversion to the yield curve peak.
- When 2s10s peaks and flattens to inversion, the S&P 500 has had positive annualized returns 100% of the time averaging 16.82% (median 11.54%).
- When the curve is inverted, the S&P 500 has had negative annualized returns 60% of the time averaging -2.05% (median - 5.97%).
- When the 2s10s steepens out of inversion until the next spread peak, the S&P 500 is up 80% of the time with average annualized returns of 17.17% (median 16.24%).
(Click on image to enlarge)
Finally, the S&P 500 tends to show strong returns when the 2s10s yield curve flattens from its peak level. The average annualized S&P 500 return from yield spread peak to trough was 14.26% (10.96% median) with 81.8% of observations showing positive returns.
(Click on image to enlarge)
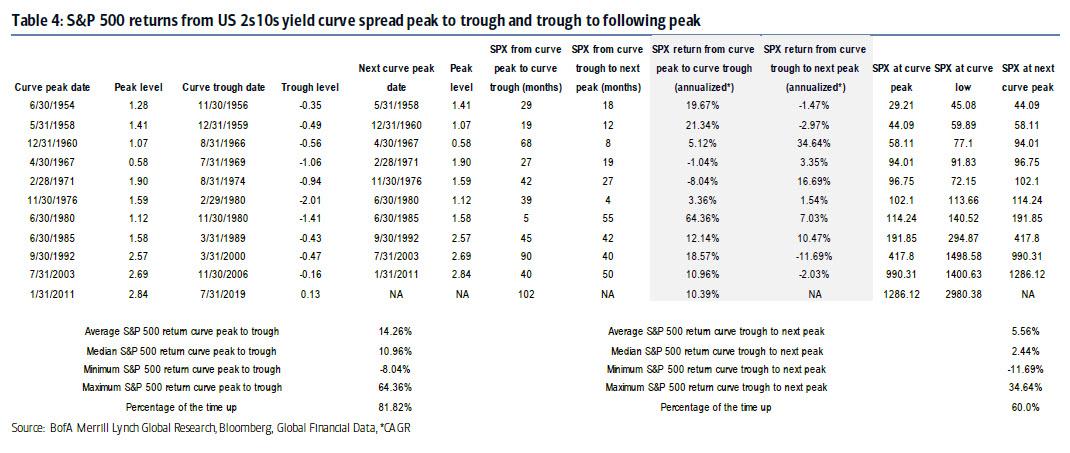
In contrast, and this goes back to why we warned that it's not the inversion but the subsequent steepening that is most painful, returns as the 2s10s treasury spread steepens showed a more muted 5.56% average return (2.44% median) with 60% of observations showing positive returns.
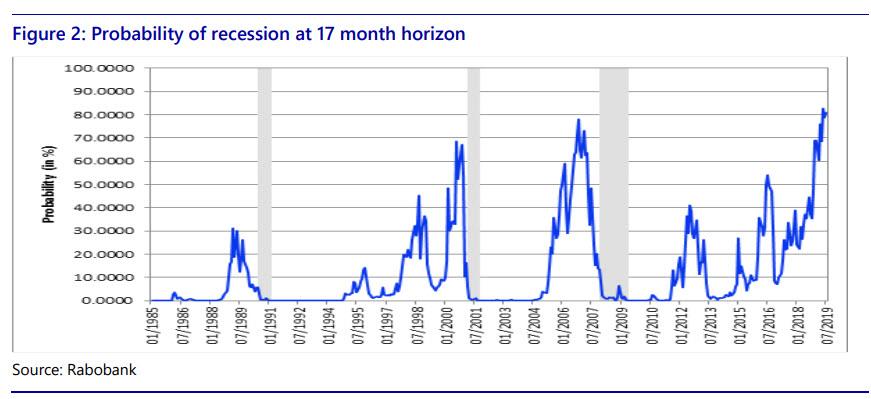
And while we now know that a recession is now on the horizon, something which Rabo accurately predicted last week when it noted its model now outputs 81% odds of an economic contraction over the next year...
(Click on image to enlarge)
... the question is what the Fed will do. Here, too, Rabo had an answer: Powell will cut back to zero by December 2020.
(Click on image to enlarge)
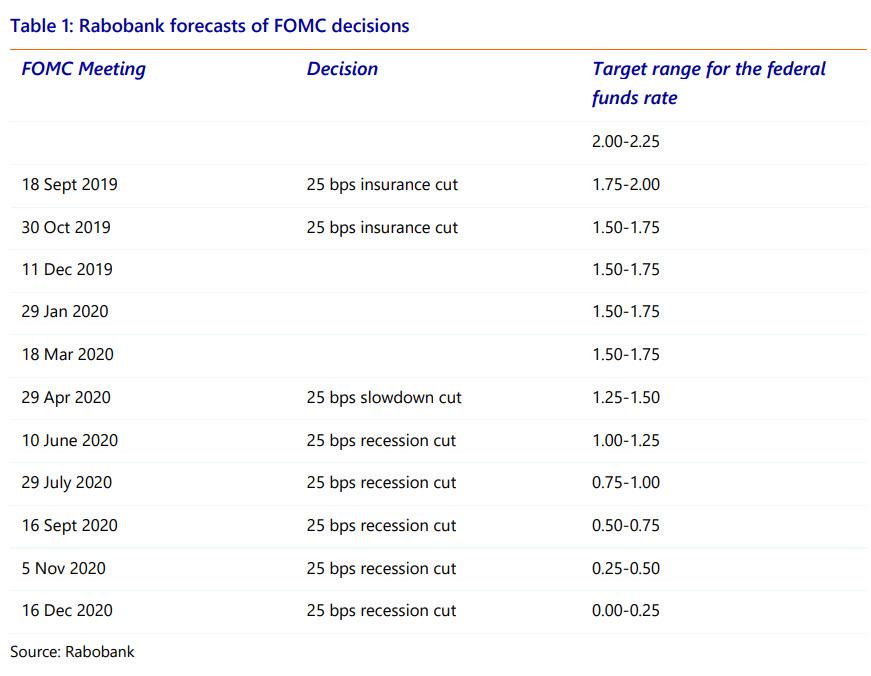
After that? Well, the financial system has to be protected, so expected more QE and NIRP to finally arrive in the US as the war against cash goes into its final lap.
Disclosure: Copyright ©2009-2019 ZeroHedge.com/ABC Media, LTD; All Rights Reserved. Zero Hedge is intended for Mature Audiences. Familiarize yourself with our legal and use policies every ...
more

