
T-Bill/10yr Treasury Spread Rising Sharply After Panic. What’s Next? A Lesson In Market Psychology
“Davidson” submits:
Multiple inputs to rates gave a historical equity sell signal when the T-Bill/10yr Treasury rate spread fell below 0.20%.
1) Chinese shifting capital to US 10yr Treasury drove rates sharply lower causing the T-Bill/10yr Treas rate spread to decline rapidly
2) Algorithms responding to trends exaggerated them which helped to drive 10yr Treas rates lower, oil prices 40% lower and ~20% correction in equity prices
Part of the misconception of well-worn indicators is that the signals for which they are known which have been incorporated in computer models is that they reflect economic conditions for which it is believed there is strong precedent. What is missed by this approach is that global financial context never repeats with the certainty on which these models rely. No model has ever captured the policy outcomes of new government leadership till those policies reveal their economic impact. We are witnessing significant policy shifts today between the US and China for which models have no precedent.
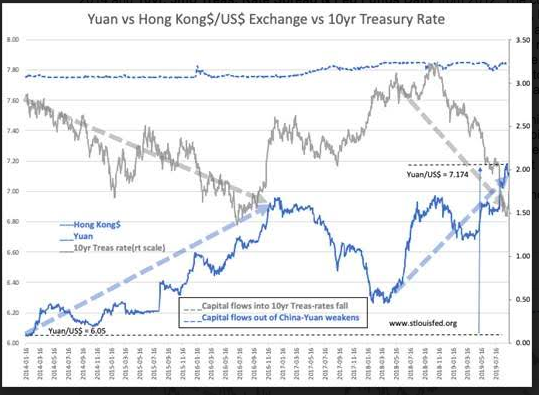
The US is in the process of responding to China’s recent shift towards autocratic governance under Xi. Xi’s shift begun in 2012 when he was appointed to China’s leadership after more than a decade what was believed to have been a gradual shift towards Democratic principles with protections to property rights. The Yuan gained strength vs the US$(US Dollar) from 2005-2013 as democratization was believed to be in process. Not obvious to the world at the time was Xi’s shift towards autocratic governance. Internally, some in China began to panic early 2014 and capital began to leave China as evidenced by the weakening Yuan/US$ exchange rate. The Yuan fell to the ~6.9 Yuan/US$ range in 2007 from ~6.1 Yuan/US$. The Sub-Prime Crisis/Great Recession of 2008 saw China add stimulus which helped in economic recovery and temporarily strengthened the Yuan back to ~6.25 Yuan/US$ by Jan 2018. Then Spring 2018 the US announced it wanted lower global tariffs in particular with China. Capital began to flow out of China weakening the Yuan and driving 10yr Treasury rates lower. More recently China has threatened to remove democratic protections from Hong Kong to which Hong Kong residents responded with an unprecedented level of protest. The Yuan vs Hong Kong$/US$ Exchange Rates daily from 2005 reflect investor responses to these events.
(Click on image to enlarge)
(Click on image to enlarge)
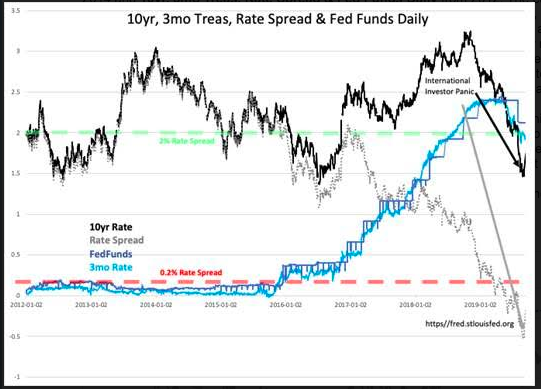
A more detailed view of the impacts of capital shifts is seen in Yuan vs Hong Kong$/US$ Exchange vs 10yr Treasury Rate daily from 2014 and 10yr, 3mo Treas, Rate Spread & Fed Funds Daily from 2012. The currency chart from 2014 includes the correlation with the 10yr Treasury rate. The correlation is nearly in lock-step. The 10yr, 3mo Treas, Rate Spread & Fed Funds Daily shows how rapidly the 10yr Treasury rate fell resulting in ‘yield curve inversion’, a signal programmed in algorithm-driven trading systems to sell equity and commodity markets especially crude oil which fell 40%. The historical signal for recessions has been when the T-Bill/10yr Treasury rate spread falls below 0.20%. On Sept 3, 2019, the rate spread averaged a negative -0.51% or 0.71% below the historical signal reflecting a high level of investor pessimism. Since this low, the rate spread has recovered to -0.20%. This is still a negative signal historically, but many now recognize after-the-fact that the impact of foreign capital inflows produced an incorrect yield curve inversion signal.
This has been a lesson in mind over matter. Investors using historical relationships missed the fact that those relationships no longer were pertinent to the global financial conditions as geopolitical events had shifted capital flows in patterns not factored previously. Market psychology based on models unable to interpret the impact of policy shifts in the US vs China turned overly pessimistic. The pessimism is now easing as earnings reports and economic indicators continue to reflect that of a general economic expansion.
Market psychology is likely to continue to shift towards optimism as economic indicators suggest no slowing of the current expansion. Equity prices should rise in response.
Disclosure: The information in this blog post represents my own opinions and does not contain a recommendation for any particular security or investment. I or my affiliates may hold positions or ...
more

