
Stuck In The Middle (Range) With You
On Tuesday, I asked the question as to whether the “bull is back” or “is it a bull trap?” This question was triggered by the outsized advance on Monday on hopes the “trade war” had been at least temporarily resolved at the G-20 summit:
“The good news is that on Monday the market cleared the 50- and 200-day moving averages. This was an important level of overhead resistance the market needed to clear to get back onto more bullish footing. However, in order for that break to be validated, it must hold through the end of the trading week.”
Unfortunately, the bulls quickly lost that foothold on Tuesday as the markets tumbled, wiping out not only all of Trump’s “trade truce” gain, but “Powell’s Put” gain as well. Then on Thursday, news the CFO of Huawei had been arrested sent shock waves through the market which sent the Dow plunging nearly 800 points. The only saving grace was when a Fed official was trotted out to suggest the Fed was likely going to pause rate hikes. But, on Friday, weaker employment, confidence, and wage growth numbers sent the markets back to their lows once again.
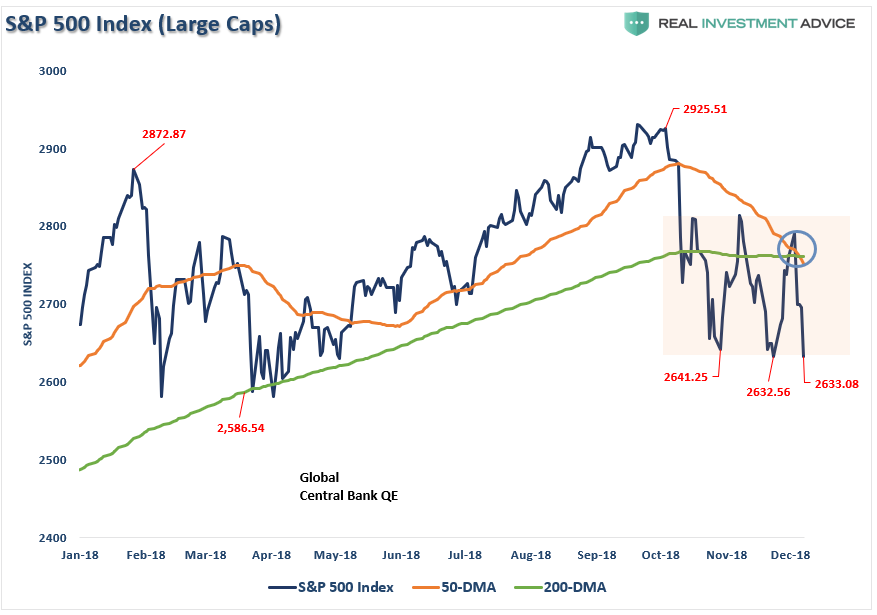
Also, while it is has been widely suggested to dismiss the negative crossover of the 50- and 200-dma moving averages (red circle), what it represents is mounting downward pressure on stock prices currently.
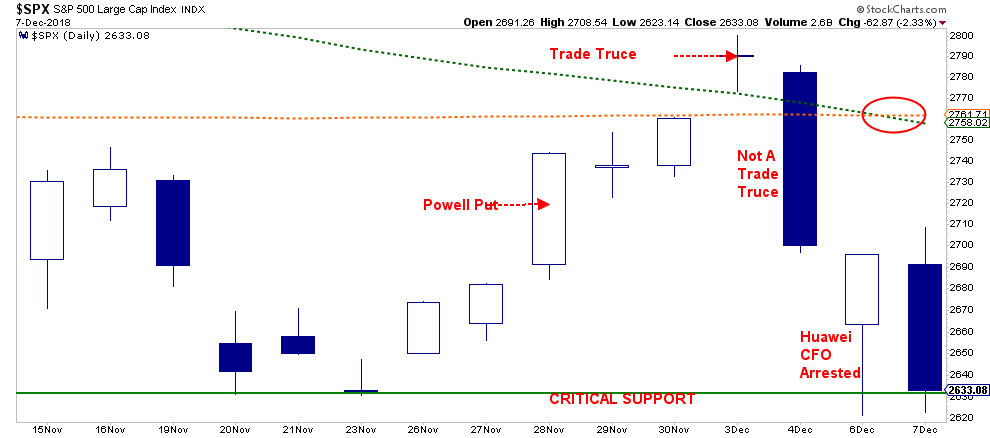
However, for all of the volatility, the market has not made any real progress since October as the “bulls” and “bears” continue to fight it out in a broad trading range as shown below. While the lower support is currently holding at 2632-ish, a failure of the that low will quickly lead to a retest of lows from March and April of this year.
So far, the consolidation of the market has continued to give supports to bulls case as sentiment has gotten very negative during this time. However, as I noted on Tuesday for our RIA PRO subscribers:
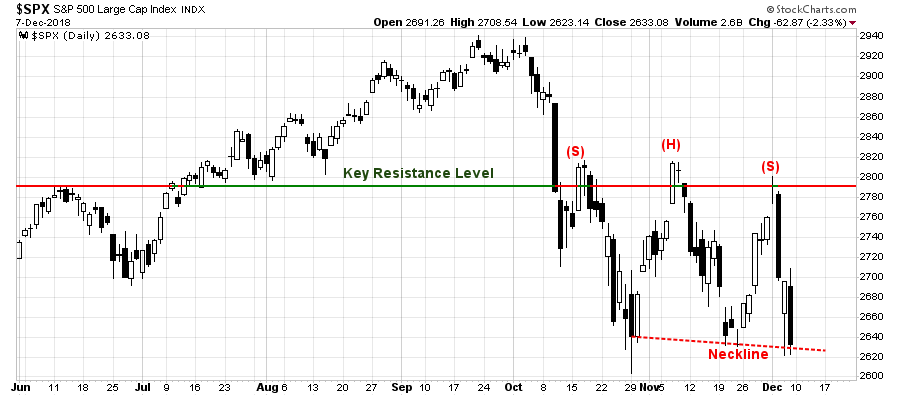
“Most importantly, the most recent failure at key resistance levels has set the market up to complete the formation of a ‘head and shoulder’ process. This is a topping pattern that would suggest substantially lower asset prices going into 2019 ‘IF,’ and this is a key point, ‘IF’ it completes by breaking the lower ‘neckline.’”
Chart updated through Friday
John Murphy via Stockcharts.com confirmed the risk to prices as well on Friday:
“S&P 500 MAY HAVE MORE DOWNSIDE TO COME …
The daily bars in the chart shows the S&P 500 retesting previous lows formed in late October and late November. And it’s trying to hold there. The shape of the pattern over the past two months, however, isn’t very encouraging. Not only is the SPX trading well below its 200-day average. The two red trendlines containing that recent sideways pattern have the look of a triangularformation (marked by two converging trendlines). Triangles are usually continuation patterns. If that interpretation is correct, technical odds favor recent lows being broken.
If that happens, that would set up a more significant test of the lows formed earlier in the year. Other analysts on this site (besides myself) have also been writing about that possibility. That would lead to a major test of the viability of the market’s long-term uptrend.”
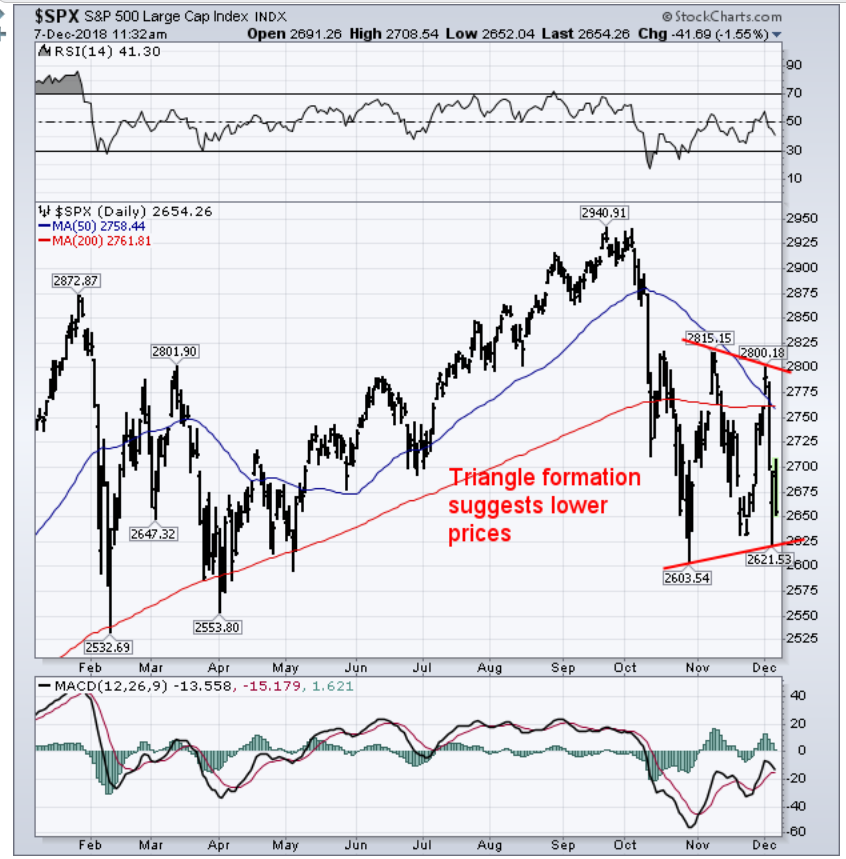
Also, note that the lower MACD is close to registering a “sell signal” which would likely coincide with further weakness in asset prices.
Is there any hope a bigger decline can be averted? Absolutely.
The recent market turmoil, which threatens both consumer confidence and the household wealth effect, has shaken the Fed from their “hawkish” position. In the next few days, the market will be analyzing Jerome Powell’s latest message as the Fed hikes rates 0.25% in December. If the language of the announcement becomes substantially more “dovish,” and signals no more hikes into 2019, the markets will initially rally sharply on the news. However, given that a Fed pause at 2.5% would signal much slower economic growth, it will likely only be a temporary boost until weaker earnings are realized from slower economic growth.
The other potential opportunity is for the current Administration to drop the “trade war” rhetoric. Given that Trump created the “trade problem” to begin with, even small gestures of trade improvement between the U.S. and China would be counted as a “Trumpian victory.” However, a reversal or reduction of the tariffs would be a boost to corporate earnings and provide a boost of confidence to corporations.
Again, as with the Fed funds rates, the reduction of tariffs would most likely only provide a short-term boost to asset prices. Eventually, the focus of the markets will turn back to earnings and economic growth which are going to slow as previous boosts from natural disasters and tax cuts fade.
However, that is in the future.
For now, we have to deal with what “IS,” and the weakness of the market is very concerning.
After having reduced equity risk a couple of weeks ago, we are looking for opportunities as they present themselves. However, for the most part, our bond positions have continued to carry the bulk of the load as of late as rates continue to drop.
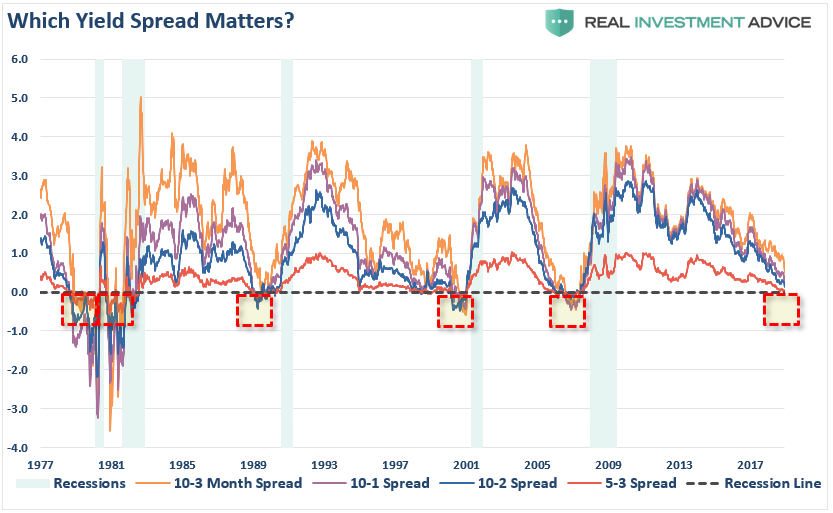
As I noted on Friday, don’t dismiss the yield curve too quickly. But like our technical indicators below, we are looking for confirmation of several curves to go negative simultaneously which has historically provided the clearest signal of a recessionary onset.
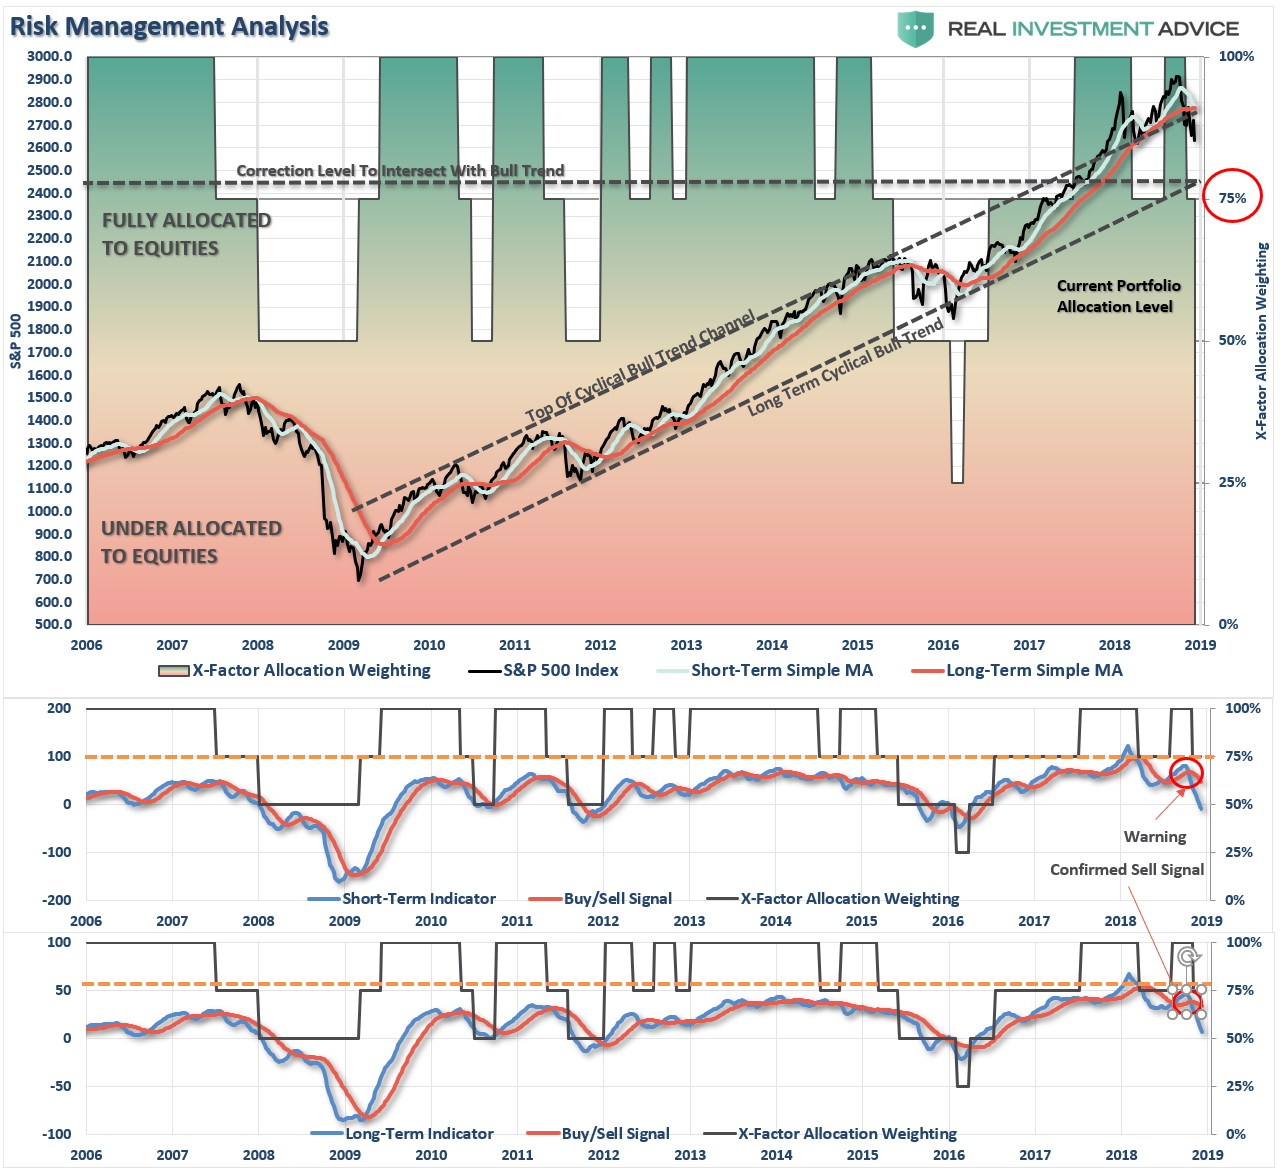
Daily View
Last week I stated:
“The rally over the past few days has virtually exhausted a bulk of the ‘oversold’ condition which previously existed. While such doesn’t mean the market can’t move higher, it simply suggests that most of the ‘fuel’ available for a rally has been utilized. With the markets still on a “sell signal” currently, and below major points of resistance, remaining a bit cautious until the underlying technical backdrop improves seems prudent.”
That turned out to be very good advice as the market retested lows once again. With the market back to “oversold” conditions (what a difference a week can make) all the market needs is any bit of “good news” to bounce. However, as noted above, with the markets sitting on major support, a rally this coming week is critical. We suggest using the rally to sell into currently to rebalance risk in portfolios.
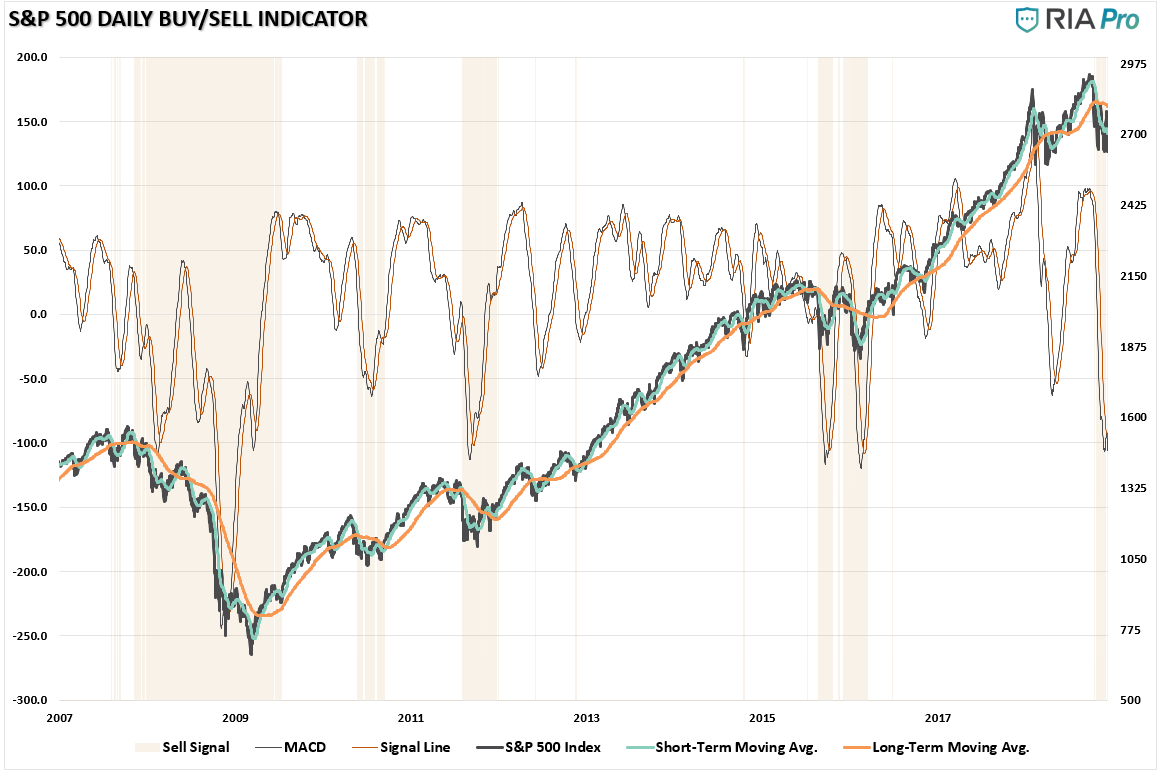
Action: After reducing exposure in portfolios previously, and portfolios much heavier in cash currently, we are giving the market time to figure out what it wants to do. Given the consolidation range over the last couple of months, it is too risky to be either overly short or aggressively long currently. Cash is the best hedge currently.
Weekly View
On a weekly basis, the story remains much the same. With a sell signal registered for only the 7th time in the past two decades, we will just allow the markets to figure out what they want to do before getting more aggressive. The recent violations of long-term moving averages suggest a change in market conditions that should not be dismissed. However, should the market improve, and ultimately reverse the relative“sell signals,” we will gladly increase exposure back to target weights.
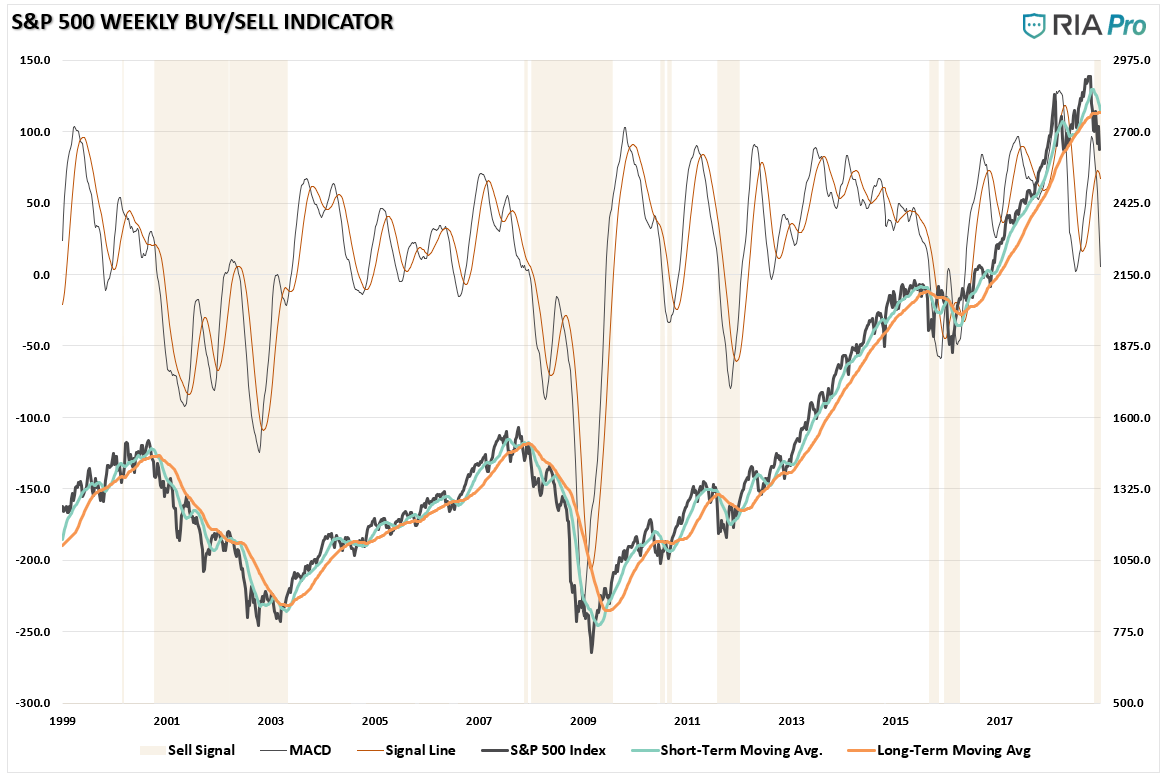
Action: Hold higher levels of cash and rebalance risk as necessary on this rally.
Monthly View
Like the daily and weekly analysis above, the market has confirmed a “sell signal” on a monthly basis as well. The good news here is that the long-term moving average, which is a critical level of bullish trend support, has NOT been violated as of yet. This suggests the longer-term bullish trend remains intact and we should not get overly conservative just yet.
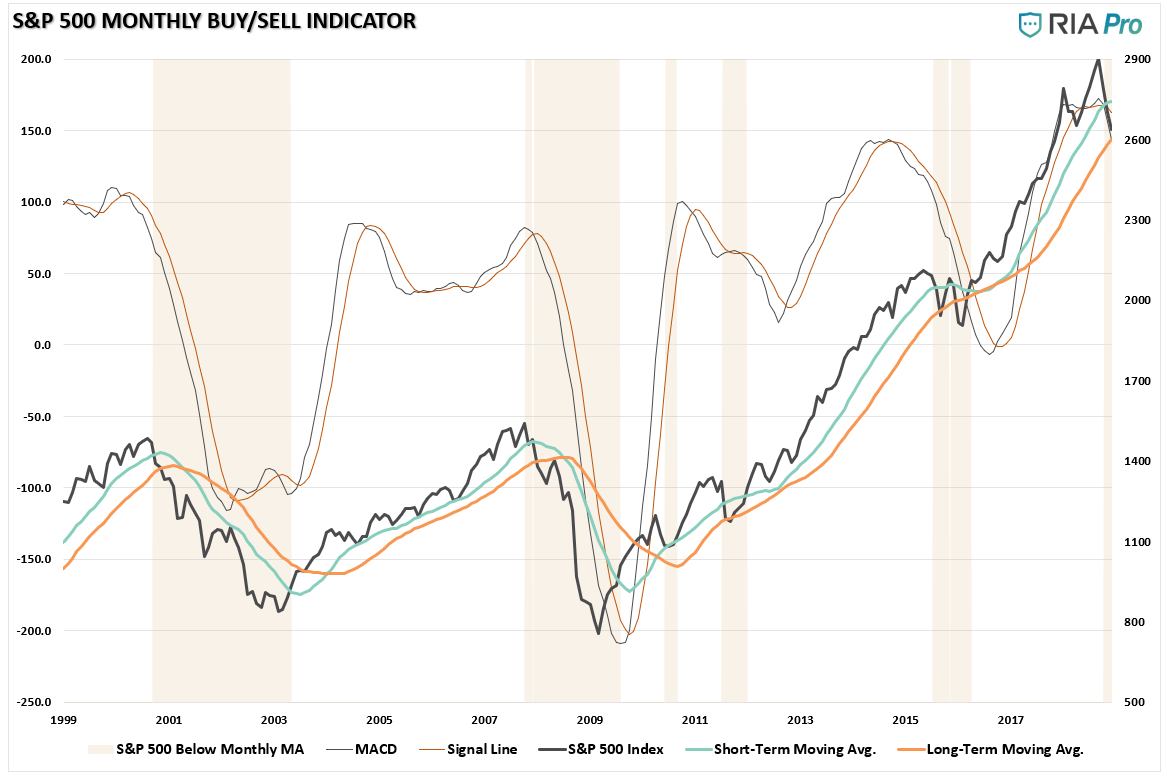
Nonetheless, the deterioration in the markets is extremely concerning, and while the official “bull market” is not dead as of yet, there are more than enough warnings which suggest erring to the side of caution, for now, is warranted.
Action: Use any rally to reduce risk and rebalance portfolios accordingly.
As always, we will keep you apprised of what we are thinking.
You can also follow our actual portfolio models and positioning at RIA PRO.
Market & Sector Analysis
Data Analysis Of The Market & Sectors For Traders
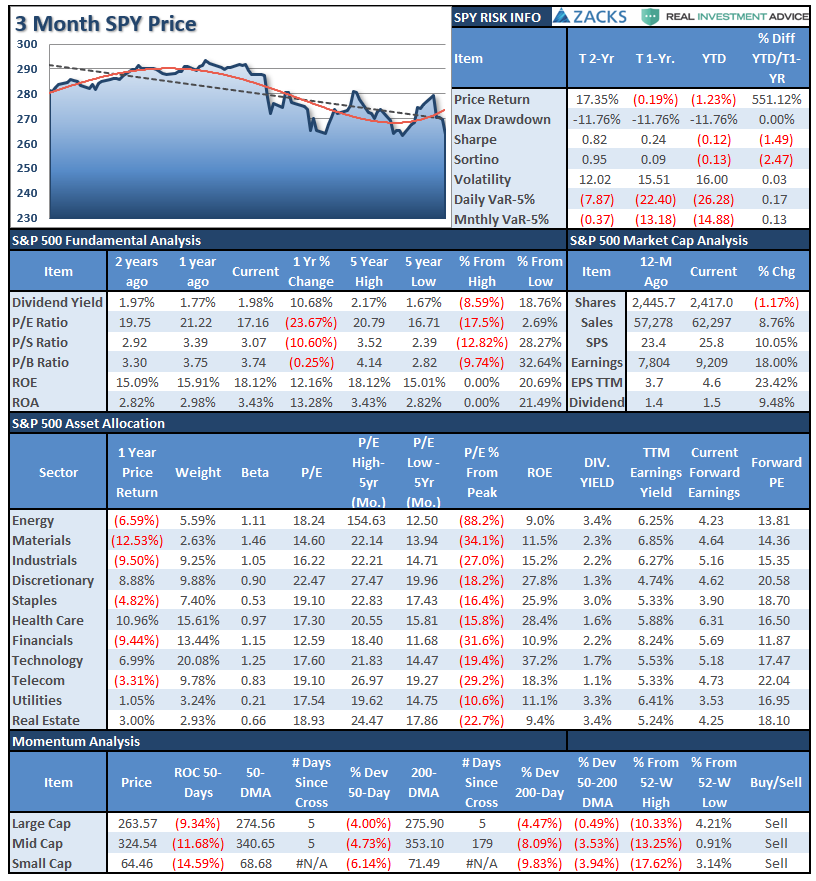
S&P 500 Tear Sheet
Performance Analysis
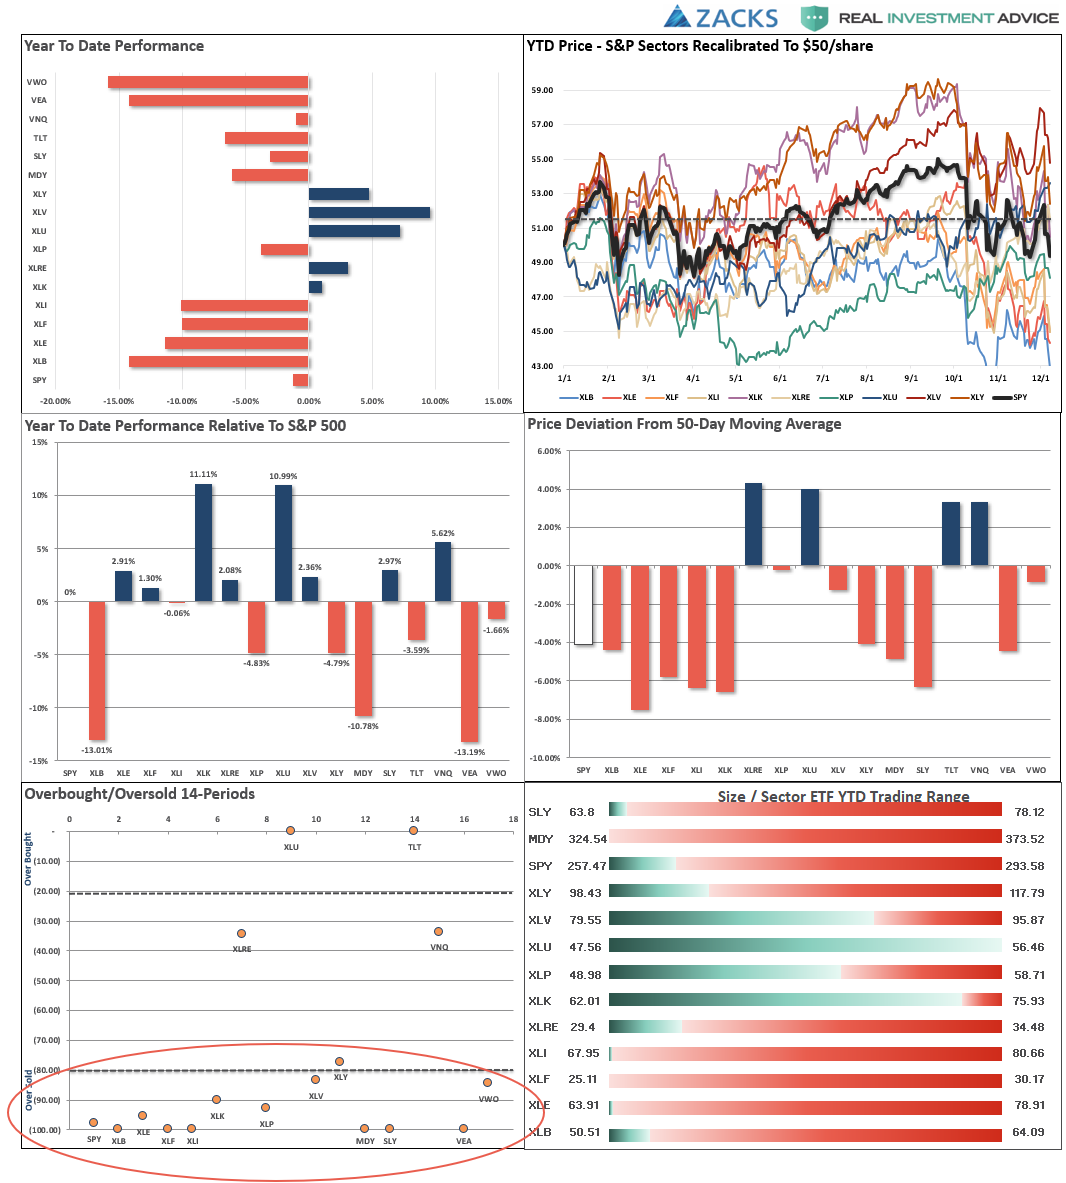
ETF Model Relative Performance Analysis
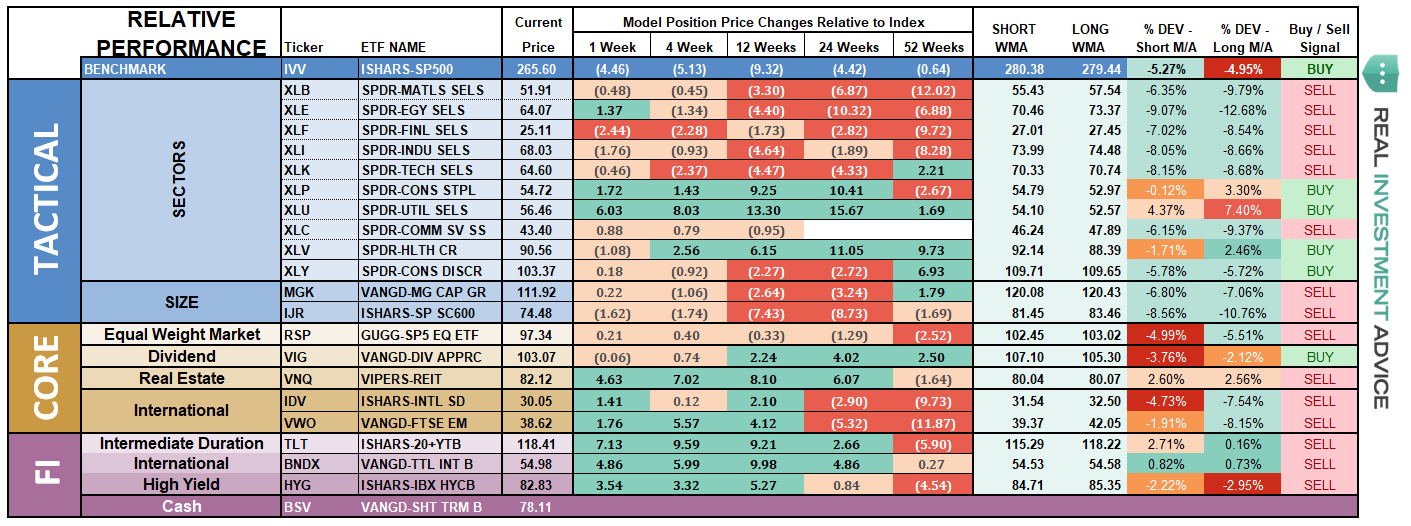
Sector & Market Analysis:
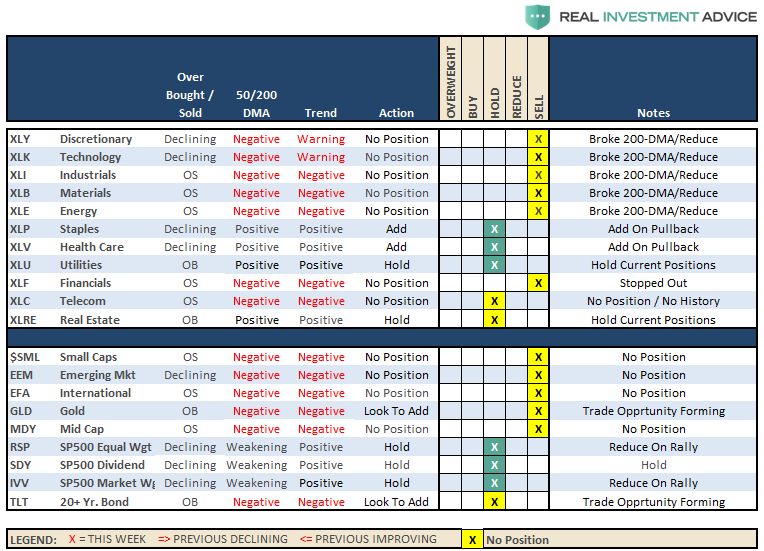
Sector-by-Sector
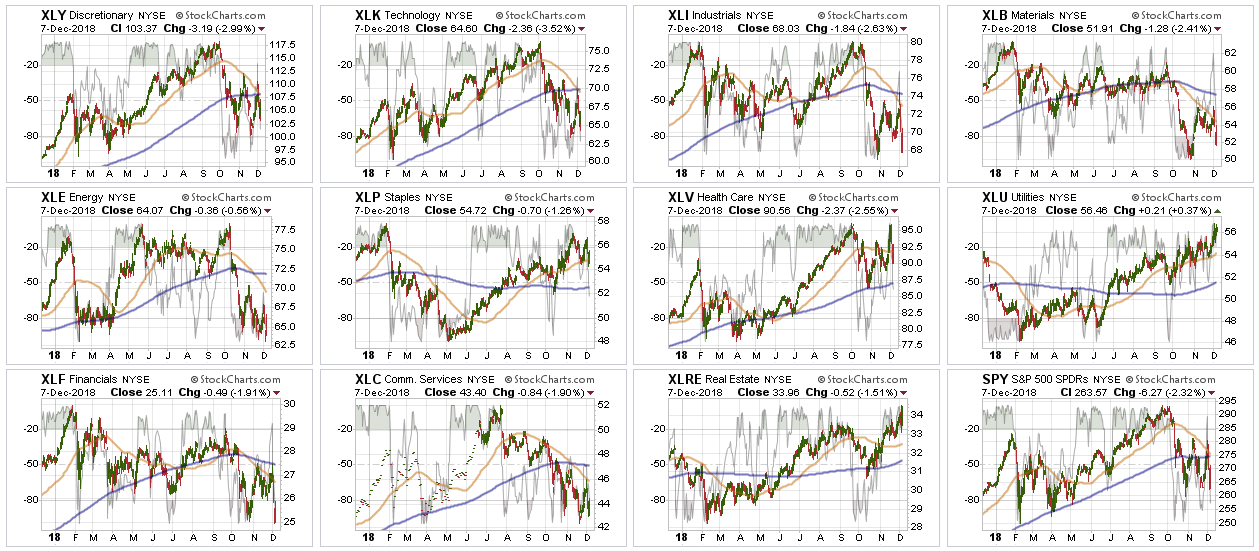
Discretionary and Technology The brief rally back above declining 50- and 200-dma averages failed last week confirming the continuing downtrend in these two sectors in particular. After having sold our positions previously, we will continue to sit on our hands until the current correction is complete. While not grossly oversold yet, I would suspect we could see a sellable short-term bounce next week.
Industrials, Materials, Energy, Financials, Communications – We are currently out of all of these sectors as the technical backdrop is much more bearish. With all of these sectors below their respective 50- and 200-dma’s, the downside pressure remains on for these sectors for now. The ongoing “trade war” and flattening yield curve is weighing on the outlook for these sectors. If you choose to be long these sectors it is advisable to reduce weightings markedly on rallies. As I have stated repeatedly over the last several months:
“Industrials, Materials, and Energy are representative of the broader economic activity in the U.S. and currently suggests we are seeing weakness on the horizon.”
Real Estate, Staples, Healthcare, and Utilities continue to be bright spots as “defensive” sectors. A warning, these are NOT safe sectors, they are defensive plays in a bull market. In a bear market, they will decline with the rest of the market, maybe just not as much. However, the dividend chase over the last several years has pushed valuations to extremes. We continue to remain long staples and healthcare specifically but the sell-off last week pushed both below their 50-dma. .Trends are still positive which may provide an opportunity to add to these sectors so we will re-evaluate again next week.
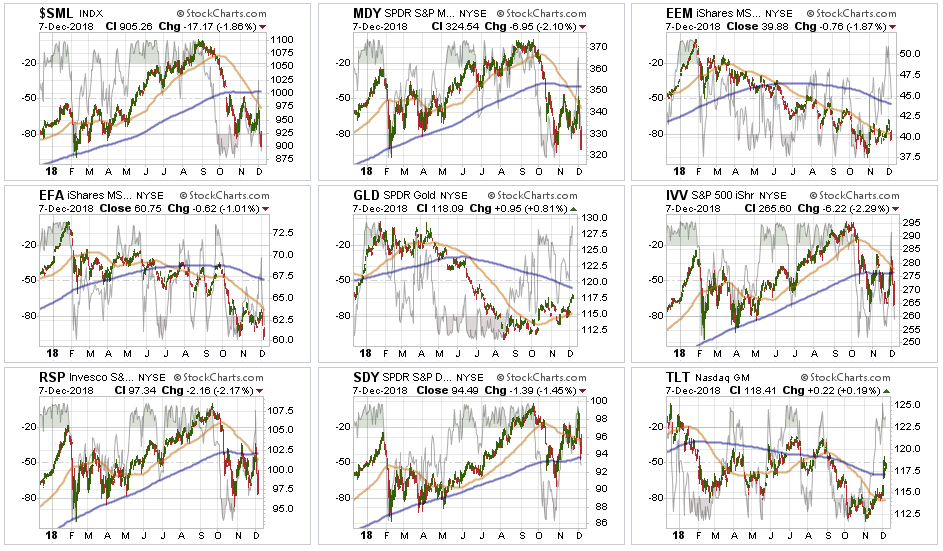
Small-Cap and Mid Cap – both of these markets are currently on macro-sell signals and the recent rally in both markets failed to get above technical resistance. As I noted last week:
“More importantly, the previous oversold condition is now gone and suggests lower prices are coming. Like Industrials and Materials above, Small and Mid-cap stocks are very economically sensitive and suggests a much weaker backdrop going into 2019. We remain out of these markets for now.”
Both of these markets are once again oversold. Small-caps broke their recent lows last week and Mid-caps are not far behind. As noted, we are out of these markets currently.
Emerging and International Markets – As noted last week:
“Emerging markets broke above its downward trending 50-dma last week and showed some signs of life. We have seen this before which ultimately led to lower lows.”
As suspected, emerging markets failed to hold above the 50-dma last week and is threatening to break the recent series of higher bottoms. A move lower next week is possible.
International markets still look terrible and no improvement is being made there just yet. With major sell signals in place currently, there is still no compelling reason to add either of these markets to portfolios at this time.
Dividends, Market, and Equal Weight – Not surprisingly, given the rotation to “defensive” positioning in the market, dividend-based S&P Index is outperforming other weighting structures. All three sold off last week as downward pressure was broad-based across all sectors. The overall market dynamic remains negative for now and important supports are being tested.
Gold – As we noted last week, while Gold remains in a downtrend, the good news is the price continues to hug along the 50-dma which has turned up. This market volatility this past week, gave gold the boost it needs to make a run for the declining 200-dma. With Gold very overbought short-term look for a pullback next week to the $115-116 area to add trading positions to portfolios with a tight stop at $112.
Bonds – continued to perform better last week and after a successful retest of the 50-dma have turned higher and broke above the 200-dma. Currently, bonds are very overbought which likely suggests a pullback is coming which would coincide with a rally in the stock market. However, such a pullback will likely provide a good buying opportunity as evidence of broader economic weakness continues to mount. We remain long our core bond holdings for capital preservation purposes and will look for a trading opportunity which does not violate the 200-dma.
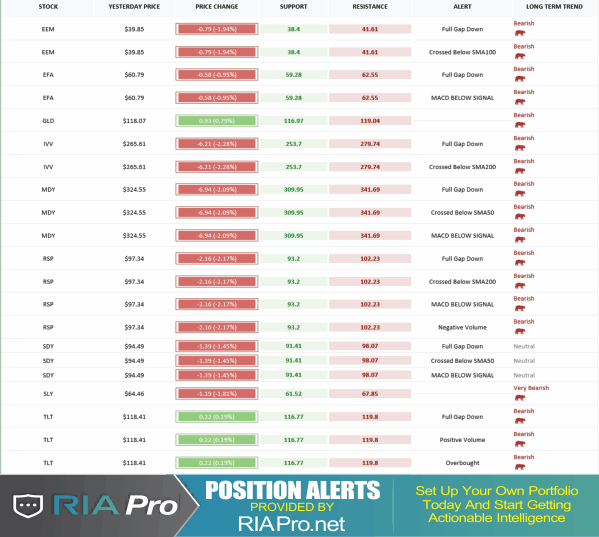
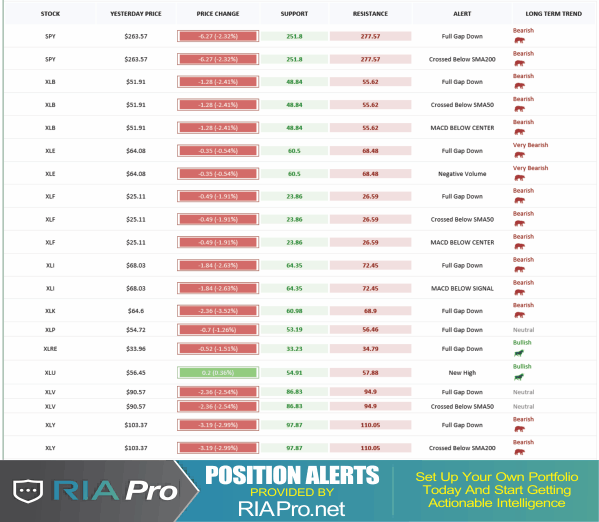
The table below shows thoughts on specific actions related to the current market environment.
(These are not recommendations or solicitations to take any action. This is for informational purposes only related to market extremes and contrarian positioning within portfolios. Use at your own risk and peril.)
Portfolio/Client Update:
As noted last week, the market action remains troubling, to say the least. The bullish trend longer-term remains intact, but more bearish dynamics continue to mount. We continue to sit on our hands with current positions and overweights in both cash and fixed income.
With the longer-term bullish trend intact, and multiple supports at current levels, it is not yet viable to short the broader market. That time will come, but shorting has capital risk just like being long. Given the recent uncertainty of the market, the best “hedge” remains cash for now.
While we expect a rally next week from short-term oversold conditions, we will remain on hold with any actions.
- New clients: We will continue to hold existing positions and sell “out of model” holdings on rallies.
- Equity Model: We will continue to hold current positions which are mostly 1/2 weights. Stops have been dramatically tightened up.
- Equity/ETF blended – Same as with the equity model.
- ETF Model: We will hold current holdings for now.
Again, we are moving cautiously. There is mounting evidence of short to intermediate-term risk of which we are very aware. However, with the market moving into the seasonally strong period of the year, we realize that short-term performance is just as important as the long-term. It is always a challenge to marry both.
It is important to understand that when we add to our equity allocations, ALL purchases are initially “trades” that can, and will, be closed out quickly if they fail to work as anticipated. This is why we “step” into positions initially. Once a “trade” begins to work as anticipated, it is then brought to the appropriate portfolio weight and becomes a long-term investment. We will unwind these actions either by reducing, selling, or hedging, if the market environment changes for the worse.
THE REAL 401k PLAN MANAGER
The Real 401k Plan Manager – A Conservative Strategy For Long-Term Investors
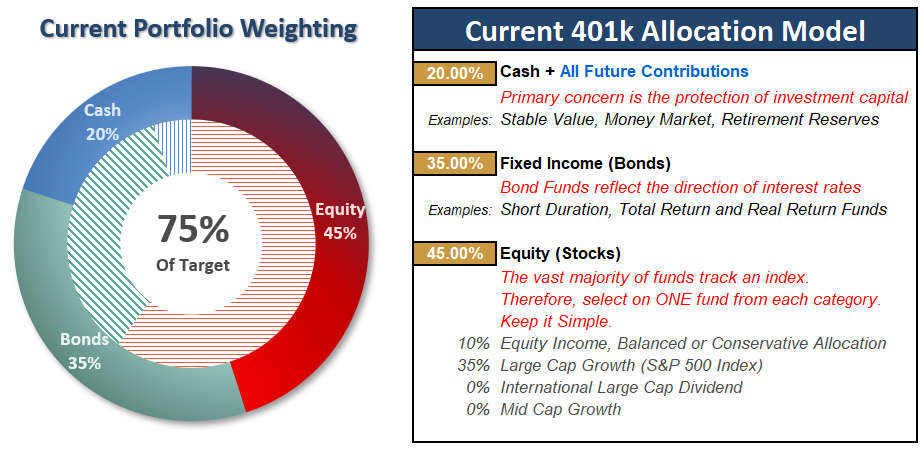
There are 4-steps to allocation changes based on 25% reduction increments. As noted in the chart above a 100% allocation level is equal to 60% stocks. I never advocate being 100% out of the market as it is far too difficult to reverse course when the market changes from a negative to a positive trend. Emotions keep us from taking the correct action.

Sit Tight, The Bear Is Still Prowling
Two week’s ago, I said it was critically important for the market to rally if the bulls were going to regain control of the market. The bulls tried and rallied the market back above the 50- and 200-dma. But that was all they could do and last week, the markets fell apart retesting recent lows.
Once again, it is critically important for the “bulls” to try and rally the market next week. As I noted last week:
“It is important to recognize that markets are generally optimistically biased and looks for ‘reasons’ to rally regardless of whether there is real ‘merit’ to it.”
With the Fed on deck on the 18th and 19th, look for more “trial balloons” next week about potential policy of stopping rate hikes. Also, it would not surprise me to start to hear more commentary from Washington about backing off some of the “trade rhetoric” with China.
Any of this would like push markets higher from deeply oversold conditions.
Given the markets remain extremely range bound, we are maintaining our current weightings in our 401k plans for now until we get confirmation about what the markets want to do next. However, with confirmed “sell signals” in place, defense remains our primary strategy for 401k-plans currently.
Continue to use rallies to reduce risk towards a target level with which you are comfortable. Remember, this model is not ABSOLUTE – it is just a guide to follow.
- If you are overweight equities – reduce international, emerging market, mid, and small-capitalization funds on any rally next week. Reduce overall portfolio weights to 75% of your selected allocation target.
- If you are underweight equities – reduce international, emerging market, mid, and small-capitalization funds on any rally next week but hold everything else for now.
- If you are at target equity allocations hold for now.
Unfortunately, 401k plans don’t offer a lot of flexibility and have trading restrictions in many cases. Therefore, we have to minimize our movement and try and make sure we are catching major turning points. Over the next couple of weeks, we will know for certain as to whether more changes need to be done to allocations as we head into the end of the year.
Current 401-k Allocation Model
The 401k plan allocation plan below follows the K.I.S.S. principle. By keeping the allocation extremely simplified it allows for better control of the allocation and a closer tracking to the benchmark objective over time. (If you want to make it more complicated you can, however, statistics show that simply adding more funds does not increase performance to any great degree.)
401k Choice Matching List
The list below shows sample 401k plan funds for each major category. In reality, the majority of funds all track their indices fairly closely. Therefore, if you don’t see your exact fund listed, look for a fund that is similar in nature.

Disclosure: The information contained in this article should not be construed as financial or investment advice on any subject matter. Real Investment Advice is expressly disclaims all liability ...
more

