
Short-Term Uptrend Continues - Saturday, May 23
The short-term uptrend continues. This short-term rally has lasted quite a bit longer than most.

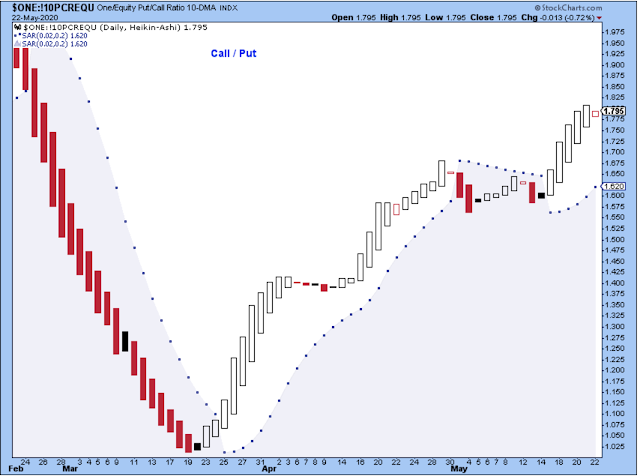
The ten-day Call/Put ratio has been choppy since the uptrend began late in March, and now there is a hollow red candle which shows some weakness again in the trend. This indicator is generally much steadier and reliable, which reinforces my view that the rally is a counter-trend within a larger downtrend.
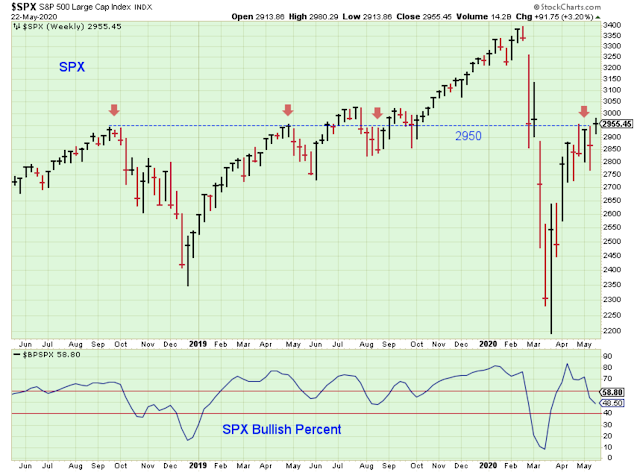
The bullish percents have also been choppy and are well under the highs of late April. I view this as a negative divergence.

New 52-week lows are cooperating very nicely with the bulls, although there have been a couple of short periods of significant spikes.

I redeployed cash back into the market early last week, and now I'm already getting a few signals to take partial profits. Getting in and out of the market so quickly is not the kind of thing I like to do, but the market's choppiness has confused my trading system. However, I feel confident that I'll be back on track soon.
There isn't much that I know for sure about the market, but one thing that I do know is that every single short-term rally is followed by a short-term decline, and that the decline is another set-up to make some money.
The Longer-Term Outlook
This is the chart I am now using to display the medium-term trend, and it is currently showing that the trend is lower.

The SPX has been battling the 2950 level for about four weeks. I'm guessing that we will get a break out rally above this level, but that will be the last gasp before the next decline. It's a guess, though.
The money supply continues to surge. This is a strong tailwind for the economy and stocks.

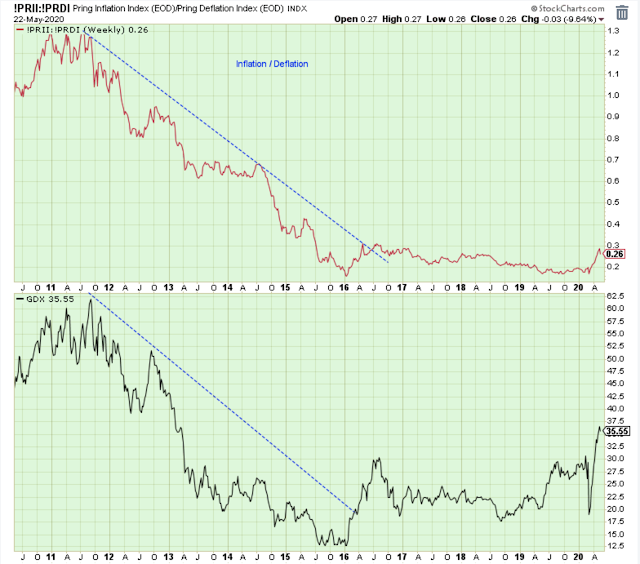
Inflation-sensitive stocks like strong growth of the M2 money supply, as you can see in the chart below. However, the top panel doesn't look that convincing yet.
Is Dow Theory still a thing? This chart says that the bear started in March, and that Transports are not confirming the strength of the Industrials, so the bear continues. This chart is using the 200-week moving average. I tried using it when it was shown on FastMoney.

Here is a look at the same chart, but expanded to 14 years. The 200-week captures the trend really well for both indexes.

Another look at the 200-week.

I don't believe that a new bull market has started, which means that, in my view, the opportunities to make money are by trading the short-term trend.
Outlook Summary
I do my best trading when I am patient and disciplined. The medium-term trend is lower, as of February 26. The short-term trend is up, as of March 24.
The economy is in recession, as of March 28. Contrarian Sentiment favors lower prices, as of May 2. The medium-term trend for Treasury bonds is up, as of January 25 (prices higher, yields lower).
Disclaimer: I am not a registered investment adviser. My comments above reflect my view of the market, and what I am doing with my accounts. The analysis is not a recommendation to buy, ...
more

