
Recovery In U.S. Inflation Breakevens Not Surprising
The rise in breakeven inflation in the United States is not particularly surprising, as it is just a return to projecting previous conditions forward. This could be mistaken, but at this point, the burden of proof is upon those who are pushing a story that inflation will be markedly higher or lower. We can easily see a replay of the dynamics of the past cycle, with President-Elect Biden pursuing similar policies to the administration where he was Vice President, and the Republican Party attempting scorched-earth debt scare tactics to force fiscal tightening.
For readers who are not familiar with the concept of breakeven inflation, it is the nominal yield on a conventional Treasury bond less the quoted yield (indexed, or "real yield") on a matched maturity inflation-linked Treasury (TIPS). I discuss the mechanics of breakeven inflation in my handbook, Breakeven Inflation Analysis. The key observation is that the breakeven inflation rate is (roughly) equal to the required rate of inflation for the TIPS and conventional bond to have the same rate of return when held to maturity -- that is, the TIPS is priced at a break-even level versus the nominal benchmark.
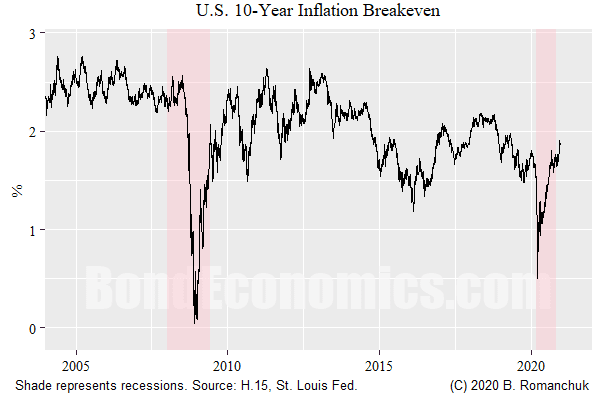
The figure above shows the 10-year breakeven inflation rate (based on the Fed H.15 report). We see that the breakeven inflation rate collapsed both this year and in 2008-2009. This was related to a drop in oil prices (an oil price bubble popped in 2008, and West Texas Intermediate futures prices briefly went negative this year). Furthermore, in 2008 being long inflation-linked bonds was an extremely crowded trade (bond market participants were also caught up in the oil price bubble), and the Financial Crisis resulted in forced liquidations (since a breakeven trade is a balance sheet intensive long/short position). Inflation-linked bonds -- like all risky asset classes -- dropped to prices that made no fundamental sense. (This may have happened to a smaller extent in 2020, but I no evidence either way).
Since inflation-linked bonds are based on overall ("headline") CPI, the inflation payout is greatly influenced in the near run by changes in energy prices. On longer horizons, it is difficult for energy prices to significantly diverge from the overall price index, so averages end up looking closer to core (ex-food and energy) inflation that economists tend to focus on. (Some believers in Peak Oil argue that energy prices will spiral out of control, but I believe that overstates what will happen to measured prices.)
The easiest way to deal with the effect of energy prices on expected inflation is to break the investment horizon into two intervals.
- The near run outlook, based on the current state of the business cycle.
- A longer run average, which is an estimate of where policymakers would like inflation to be.
As an example, I would break up the 10-year inflation breakeven into the first 5 years (the spot 5-year breakeven inflation rate), plus the 5-year breakeven starting 5 years forward. (The advantage of that separation is that the 10-year breakeven is just the average of those two levels.)
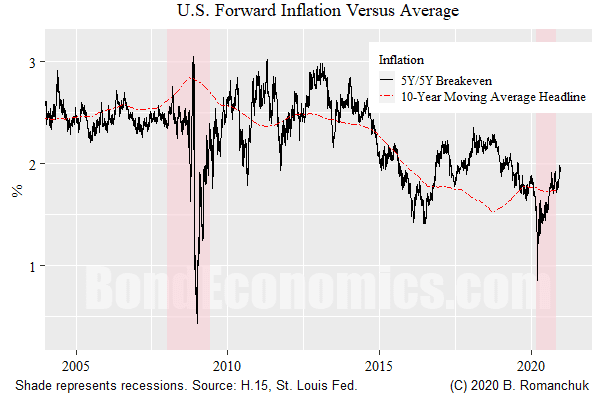
The figure above shows the 5-year, 5-year breakeven inflation rate (I used the series calculated by the Fed) compared to the 10-year moving average of the CPI inflation rate. (A cleaner series would be the 10-year annualized inflation rate, but this series is easier for readers to replicate.)As seen, the forward rate just reverted to slightly above the historical average. If one wanted to use the 10-year moving average as an adapted expectations, this is consistent with there being a small inflation risk premium in TIPS (actual inflation needs to be slightly higher than the expected level of inflation to break even).
(The issue of risk premia in inflation-linked bonds is a thorny question. There are two plausible, countervailing forces. Inflation-linked bonds are less liquid, and they should be cheaper than conventional government bonds -- which are a pricing benchmark. Conversely, there is a mismatch between the supply and demand of inflation protection, with a far greater demand for protection than there is supply. This ought to result in inflation-linked bonds being expensive -- breakevens above inflation. Since we do not know exactly what market participants expectations for inflation are, and there is only a single spread between the observed breakeven and this forecast level, it is extremely hard to come up with a plausible model for the premium. That said, this is only a concern for academics or central bankers -- as an investor, you know what your own inflation forecast is, and you can set your own target risk premium.)
Although adaptive expectations are sneered at by modern academics, their use is justifiable as long as one understands the risks. The choice of 10 years in the moving average was not accidental -- 10 years largely matches the length of recent expansions. The cyclical average tells us where overall policy settings (i.e, fiscal, monetary, and regulatory policy) have let inflation settle. Unless those policy preferences change, the best guess is that future inflation will tend to settle near those levels. Meanwhile, if one looked at a long history of the average of inflation, we see that the average has settled into a relatively small range since the early 1990s.
I am extremely unconvinced by stories that there has been a secular change in policymakers' views towards inflation. As such, I see no reason to argue against where forwards are. As for the near-run inflation forecast, even if I wanted to be a forecaster (which I am not), my feeling is that the outlook is murky. The current situation is somewhat unprecedented in the modern era, with a mixture of unemployment alongside industries hitting capacity constraints. Meanwhile, it is hard to judge how large the post-vaccine bounce will be.
Finally, one popular belief is that "breakevens have nothing to do with inflation". That is the type of thinking that drove the forward breakeven inflation rate down to 1.5%, which generated a good trading opportunity for anyone who disagreed with that sentiment.
Disclaimer: This article contains general discussions of economic and financial market trends for a general audience. These are not investment recommendations tailored to the particular needs of an ...
more

