
Rare Shift In Stock/Bond Ratio
WEEKLY CCI
The commodity channel index (CCI) can be used to identify rare and extreme shifts in investor conviction. From stockcharts.com:
In general, CCI measures the current price level relative to an average price level over a given period of time. CCI is relatively high when prices are far above their average, but is relatively low when prices are far below their average.
A rare shift was recently completed on the stock/bond chart below, which shows the performance of the Vanguard Index 500 relative to the Vanguard Long-Term Treasury Fund. Weekly CCI dropped below -250 in December 2018, which indicated a very high conviction to own defensive bonds relative to growth-oriented stocks. With some help from the Federal Reserve, CCI was able to recapture the centerline and closed above 100 on April 12, 2019.
(Click on image to enlarge)
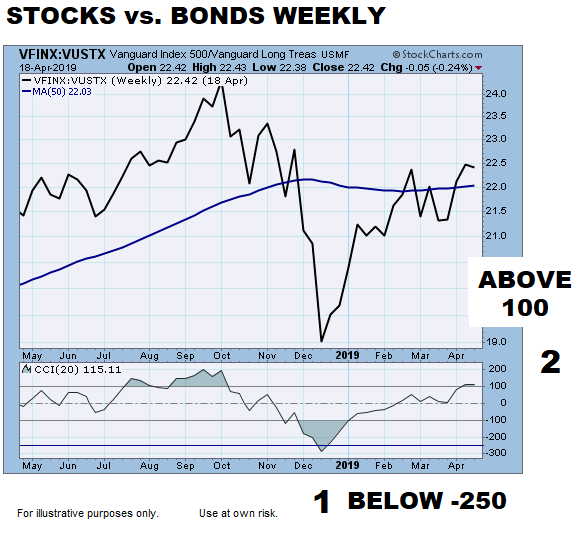
The shift above (from 1 to 2) took place over 3.7 months (relatively quickly). Since we are looking for shifts similar to the 2018-2019 shift, we confined our search to historical cases where the 1-to-2 shift took place in 7.0 months or less.
FIVE SIMILAR SHIFTS
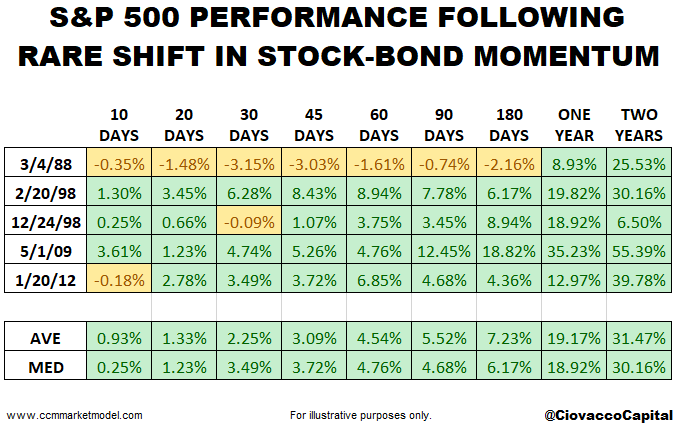
Data for VFINX/VUSTX dates back to 1986. A similar shift (1986-2019) in weekly CCI for the stock/bond ratio has only taken place five previous times. The table below shows S&P 500 performance following the first weekly close with CCI above 100 after CCI dropped below -250. Average and median S&P 500 performance was positive over the next two years, telling us to remain open to better than expected outcomes.
(Click on image to enlarge)
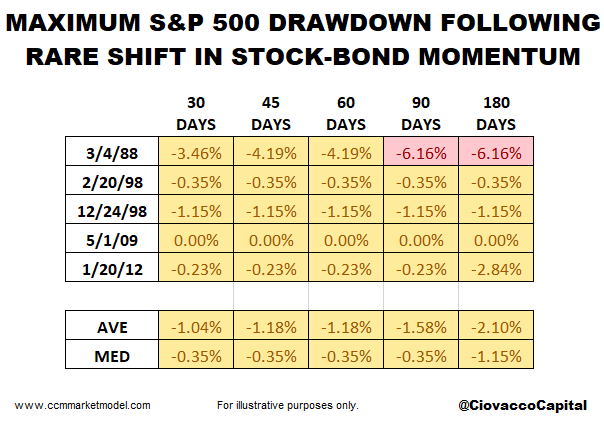
In the historical cases, after CCI crossed back above 100 (similar to April 12, 2019), the S&P 500 did experience some volatility. However, the maximum historical drawdown was a fairly muted 6.15%. The median drawdown was 1.15% over the next 180 days.
(Click on image to enlarge)
SLOWING SHORT-TERM MOMENTUM VS. LONG-TERM MOMENTUM
This week’s stock market video examines a rapid shift in a popular breadth indicator, the NYSE Summation Index. The video also reviews asset class behavior and short-term S&P 500 momentum to gain insight into the odds of good things happening relative to the odds of bad things happening.
Disclaimer: The opinions in this document are for informational and educational purposes only and should not be construed as a recommendation to buy or sell the stocks mentioned or to solicit ...
more

