
Peeking Into The Future Through Current Hedge Fund Positions
Following futures positions of non-commercials are as of March 3, 2020.
10-year note: Currently net short 156.7k, down 117.3k.
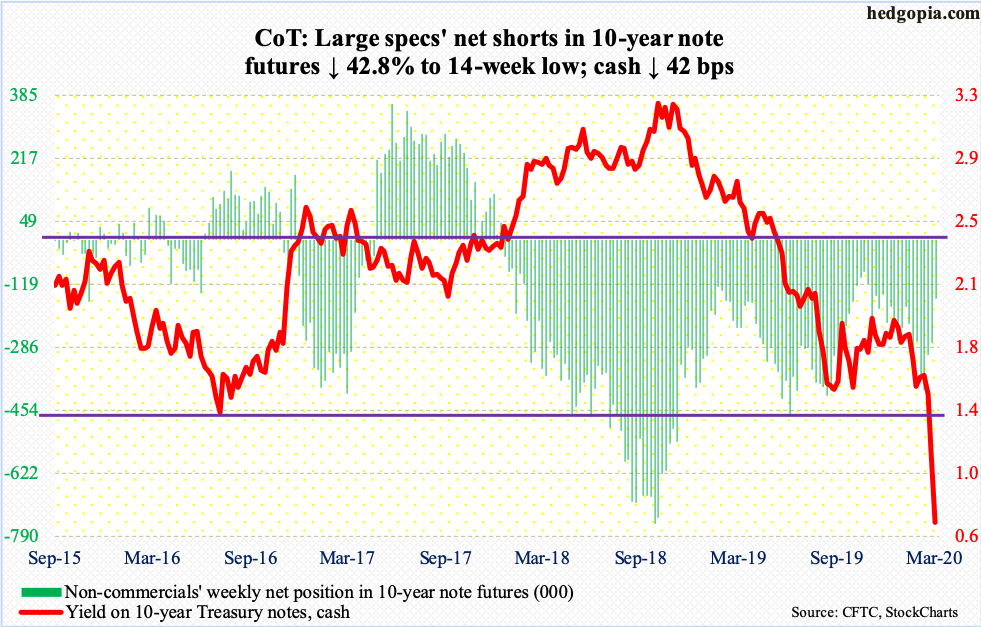
It seems nothing matters. On a day the bond market found out the US economy produced much-better-than-expected 273,000 non-farm jobs in February, the 10-year Treasury yield (0.71 percent) tumbled 22 basis points on Friday. At session lows, rates, which were already under pressure, touched 0.66 percent – of course a new record low. For the week, they gave back 42 basis points. In two weeks, rates have been more than cut in half. Unreal!
Back in October 2018, the 10-year peaked at 3.25 percent. As did equities, which then bottomed in December that year. Since that trough through its recent record high, the S&P 500 large cap index jumped 45 percent. The bond market never fell for it. The 10- and 30-year continued lower, with the former suffering a major breakdown when last month it pierced through the lows from July 2012 and July 2016 – 1.39 percent and 1.34 percent, respectively.
Equities are now catching up to it.
Only three weeks ago, non-commercials held 398,919 net shorts in 10-year note futures. These notes were yielding 1.59 percent then. As of Tuesday, they held 156,684 contracts. Short squeeze helped drive the rates lower. This technical factor definitely played a role in the recent collapse in yields, but at the same time the speed by which the drop has come deserves attention. The bond market is forecasting meaningful slowdown in the economy, if not outright contraction.
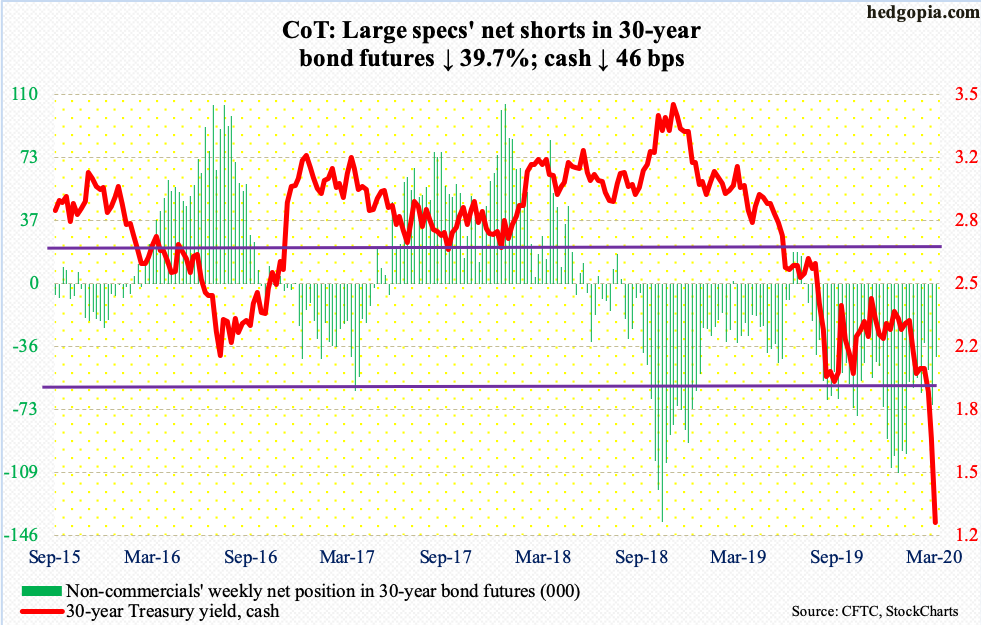
30-year bond: Currently net short 42.6k, down 28.1k.
Major economic releases next week are as follows.
The NFIB optimism index (February) is scheduled for Tuesday. Small-business optimism in January increased 1.6 points month-over-month to 104.3. The index has remained north of 100 since December 2016, including record 108.8 in August 2018.
Wednesday brings the consumer price index (February). Headline and core CPI respectively edged up 0.1 percent and 0.2 percent m/m in January. In the 12 months to that month, they respectively increased 2.5 percent and 2.3 percent.
The producer price index (February) comes out Thursday. In January, PPI and core PPI increased 0.5 percent and 0.4 percent m/m, in that order. In the 12 months to January, they respectively advanced 2.1 percent and 1.5 percent.
The University of Michigan’s consumer sentiment index (March, preliminary) is on tap Friday. In February, consumer sentiment rose 1.2 points m/m to 101. Except for last August’s 89.8, sentiment has remained north of 90 since November 2016, five of which were 100 or higher.
WTI crude oil: Currently net long 567.4k, down 57.3k.
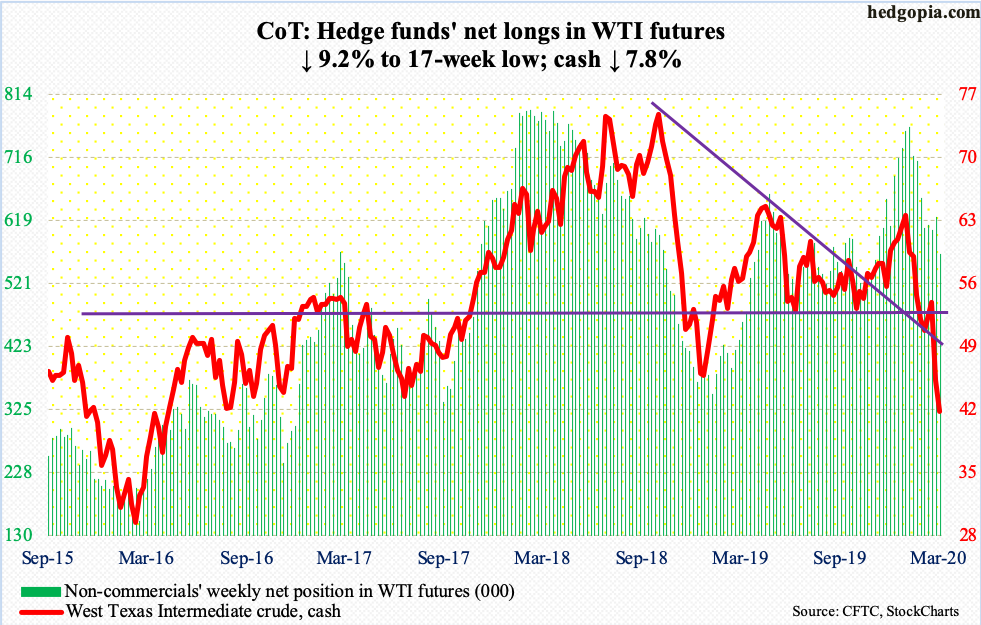
The cash ($41.28/barrel) collapsed 7.8 percent this week. For oil bulls, $42-43 was a make-or-break. They can still salvage the damage, but odds are beginning to get stacked against them.
Friday, OPEC and Russia failed to agree on production cuts. OPEC Thursday proposed crude oil output be cut by 1.5 million barrels a day through June 30, with the 14-member group cutting one mb/d and 10 non-member allies including Russia cutting 500,000 b/d. This group of nations, collectively known as OPEC+, has had a production cut agreement in place since January 2017. Last December, the deal was extended but is set to expire at the end of this month. Beginning next month, producers are on their own. This at a time when demand is taking a hit owing to the coronavirus.
In the meantime, US crude production rose to a fresh high 13.1 mb/d, up 100,000 b/d. The EIA report for the week of February 28 also showed crude imports edged up 21,000 b/d to 6.2 mb/d. Crude stocks, too, rose – up 784,000 barrels to 444.1 million barrels. Gasoline and distillate stocks, however, fell by 4.3 million barrels and four million barrels respectively to 252 million barrels and 134.5 million barrels. Refinery utilization dropped by one percentage point to 86.9 percent.
E-mini S&P 500: Currently net long 5.2k, down 50.4k.
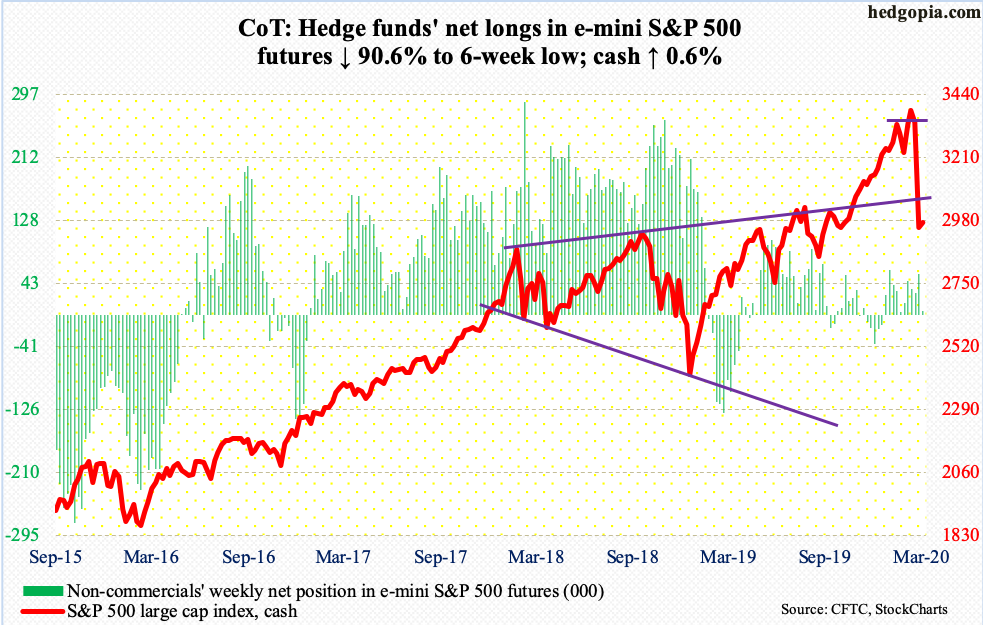
Last Friday as the cash (2972.37) made an intraday low of 2855.84, bulls aggressively bought that decline, defending last October’s low of 2855.94. This of course took place amidst a crazy week in which the S&P 500 lost 11.5 percent. After that Friday reversal, bulls this week tried to build on that, with limited success.
For the week, the S&P 500 rose 0.6 percent. At one time, it was up as much as 6.2 percent. Nimble traders probably did very well. It was a volatile week, to say the least, with Monday up 4.6 percent, Tuesday down 2.8 percent, Wednesday up 4.2 percent, Thursday down 3.4 percent and Friday down 1.7 percent.
The roller-coaster action makes sense in that last week’s technical damage is in need of repair. Shorter-term averages are still dropping. From bulls’ perspective, as long as 2800-plus is not breached, they should be fine with the current consolidation – particularly considering continued outflows. Even if a rally ensues from the current level, this probably will not mark a major bottom. Investor sentiment, measured by Investors Intelligence, is yet to wash out (more on this here). Having said that, the NAIIM Exposure Index this week was slightly lower than the December 2018 low (chart here).
After losing $22.1 billion in the prior week, US-based equity funds lost another $20.3 billion in the week to Wednesday (courtesy of Lipper). In the same week, SPY (SPDR S&P 500 ETF), VOO (Vanguard S&P 500 ETF) and IVV (iShares Core S&P 500 ETF) together lost $26 million (courtesy of ETF.com). This was an improvement from the prior week in which $12.7 billion was withdrawn.
Euro: Currently net short 86.7k, down 27.3k.
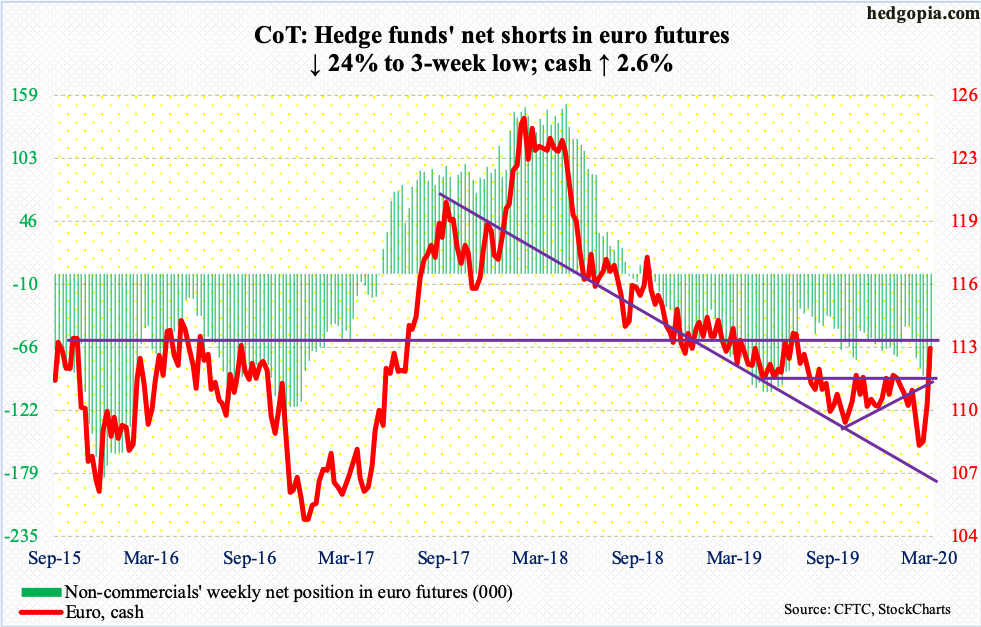
After last Thursday’s gap-up, the cash ($113.08) began and ended this week with more gap-ups. In the process, both the 50- and 200-day were recaptured. Merely 12 sessions ago, the euro bottomed at $107.82.
The daily is beginning to get extended, but the weekly has room to continue higher. On December 31, the currency retreated after printing $112.40. This was surpassed this week, for a higher high.
In the event the euro pulls back near term, $111.80s has decent support.
Gold: Currently net long 319.7k, down 16.1k.
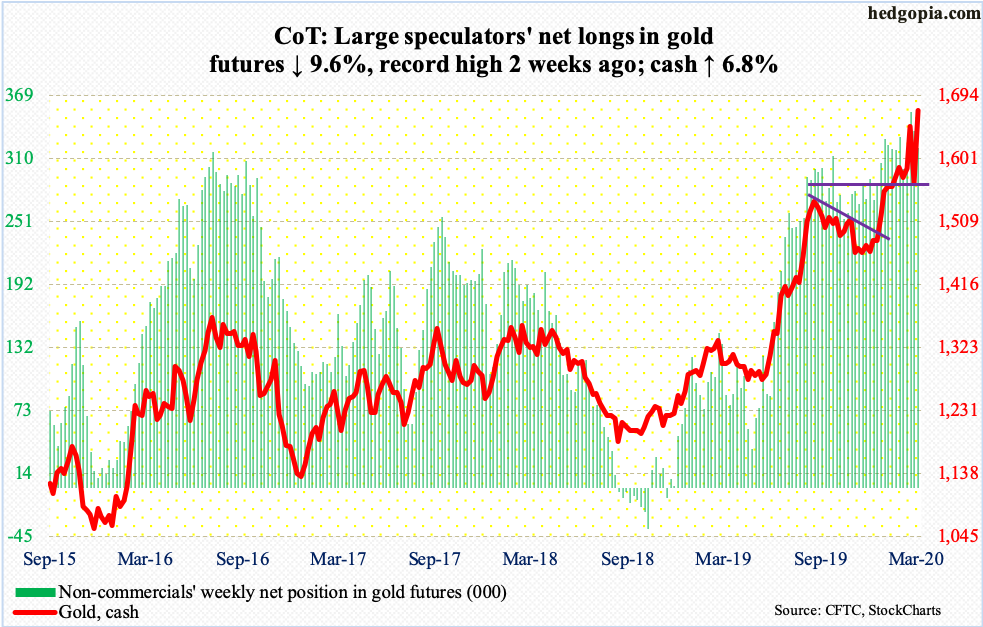
Gold-focused ETFs continue to be popular. In the week to Wednesday, IAU (iShares Gold Trust) gained $384 million and GLD (SPDR Gold ETF) $358 million (courtesy of ETF.com). In the prior six, GLD took in $2.9 billion.
On February 24, the cash ($1,672.40/ounce) made an intraday high of $1,691.70 before coming under pressure. By last Friday, gold was down to $1,564 – landing right on the 50-day. Plus, $1,550s-60s held crucial support, which held. This week, gold was again bid up – up 6.8 percent for the week. The high from 10 sessions ago has taken on importance. In fact, the metal posted $1,692.80 intraday Friday, but gold bugs were unable to hang on to it, with the session ending in a long-legged doji.
Nasdaq 100 index (mini): Currently net long 32.2k, down 7.4k.
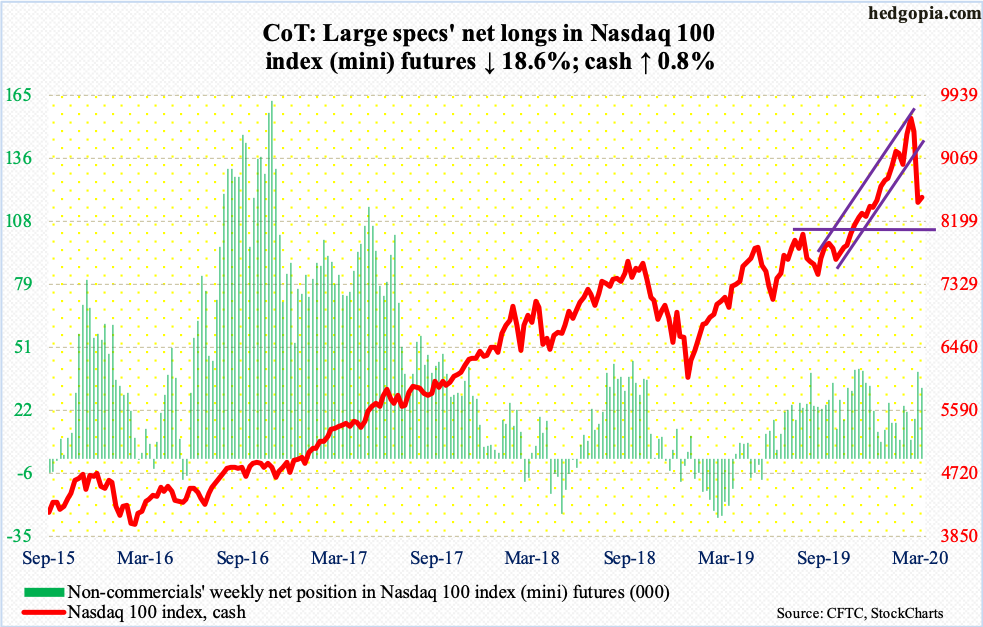
Reversing outflows of $603 million in the prior week, QQQ (Invesco QQQ Trust) took in $172 million in the week to Wednesday (courtesy of ETF.com).
Two weeks ago, for the first time since last October, the daily RSI on the cash (8530.34) fell below 50, before proceeding to drop below 30 in last week’s rout. This week, it rose back above 30 but was denied Wednesday just under the median. Momentum needs to pick back up soon. Else, it is possible the Nasdaq 100 once again will try to test the 200-day (8170.66). Five sessions ago, the average was successfully defended (more on this here).
Russell 2000 mini-index: Currently net long 23.2k, down 25k.
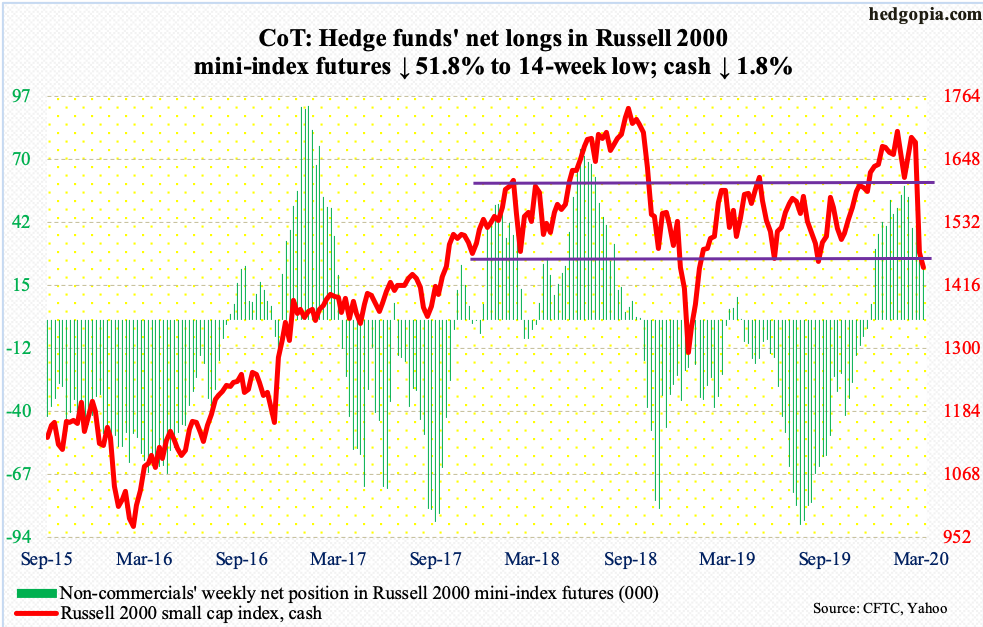
Last Friday, small-cap bulls successfully defended major support at 1450s, where the cash (1449.22) found bids waiting several times last year, including early October. After last week’s bottom, the subsequent rally was cut short Tuesday after the Russell 2000 (IWM) made an intraday high of 1539.74 Tuesday. Once again, the aforementioned support is being tested. In fact, intraday Friday it was meaningfully broken as the index dropped to 1417.27 intraday. Breach risks are rising. A genuine breakdown likely opens the door toward 1300-1350 in due course. In this scenario, flows likely take a hit.
In the week through Wednesday, IWM (iShares Russell 2000 ETF) attracted $1.1 billion, while IJR (iShares Core S&P Small-Cap ETF) lost $39 million (courtesy of ETF.com).
US Dollar Index: Currently net long 22.5k, down 2.6k.
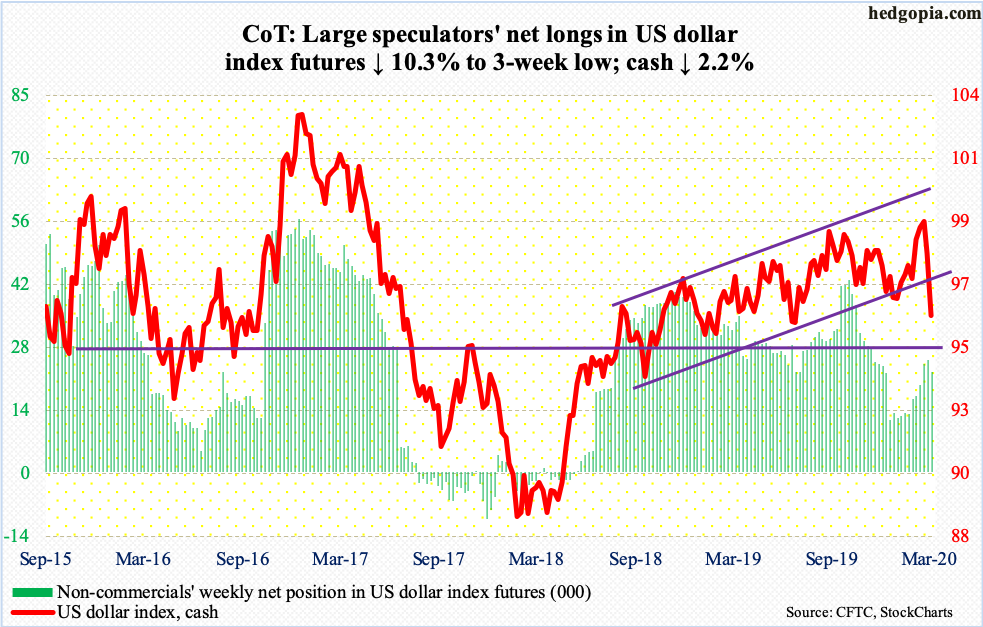
Three weeks ago, the cash (95.93) tagged 99.82 intraday only to get rejected at channel resistance from August 2018, with a weekly shooting star. This was followed by back-to-back down weeks. This week, the US dollar index lost 2.2 percent. Thursday, it tested the lower end of the channel in question – successfully. Friday, it gave way; intraday, in fact, horizontal support at 95-95.50 was tested. Dollar bulls, who have their backs against the wall currently, cannot afford to lose this.
VIX: Currently net short 57.5k, down 20.1k.
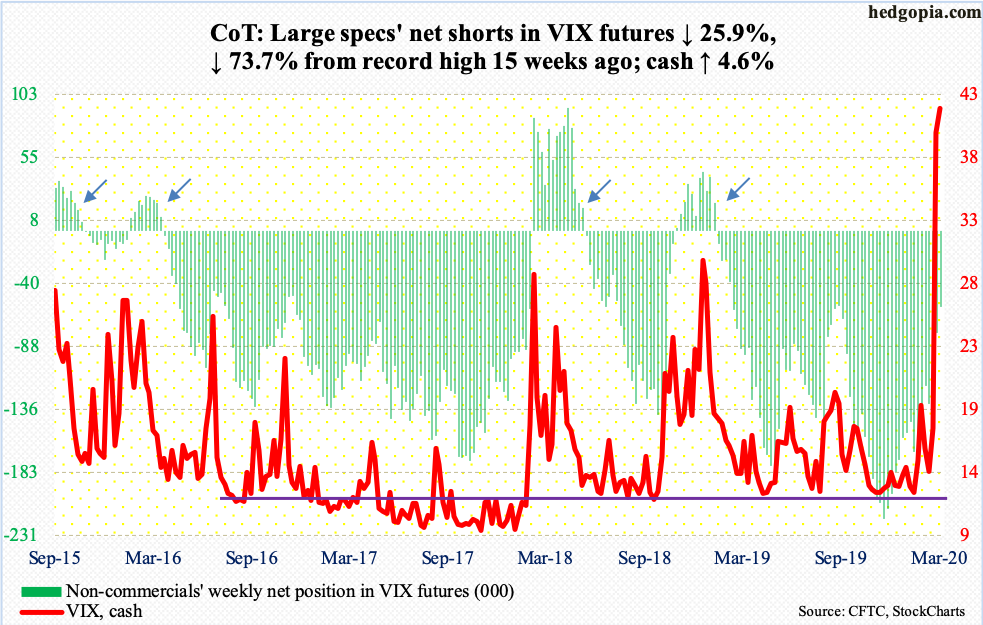
Last Friday, the cash (41.94) retreated after rising to 49.48 intraday. This Friday, it spiked to 54.39 intraday before reversing hard; this was the highest print since January 2009. In all five sessions this week, VIX closed above 30, except on Tuesday it dropped to 24.93 intraday. Volatility is holding up.
Yet, Friday’s potential spike reversal is worth watching. In the past, such reversals preceded sustained downward pressure.
Plus, as of Tuesday, non-commercials held 57,486 net shorts in VIX futures, down from record 218,362 contracts mid-November. Several times in the past, the cash only peaked once these traders either went net long or substantially reduced their net shorts.


