
Peek Into The Future Via Futures: This Week's Commitment Of Traders
Following futures positions of non-commercials are as of August 21, 2018.
10-year note: Currently net short 700.5k, up 2.3k.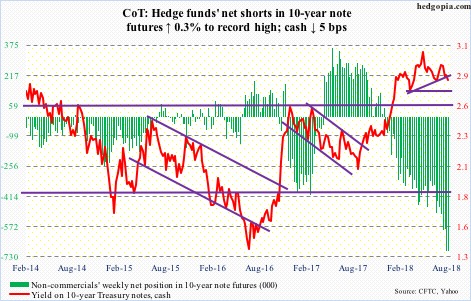
The 10-year T-yield (2.83 percent) lost five basis points this week. The neckline of a potentially bearish head-and-shoulders formation has been broken. The way yields have gone up and down since January, it is a rising neckline that has been broken. Another one – a straight one – can also be drawn, and this one does not break until 2.75 percent. The 200-day moving average lies at 2.77 percent. If this breaks, technicians would be eyeing 2.35 percent for completion of the pattern.
Here is the thing. Should things evolve this way, on its way there, yields would have broken 2.6 percent, which stopped rally attempts for more than a year until they broke out this January. Besides, a trend line from July 2016 when yields fell to an all-time low of 1.34 percent extends there. Bond bears do not want to see a breach of this level. When it is all said and done, they may have themselves to blame. The record amount of net shorts in 10-year-note futures that they have accumulated can act as a self-fulfilling prophecy. As yields drop, they drop more as shorts give in.
30-year bond: Currently net short 8.5k, down 18k.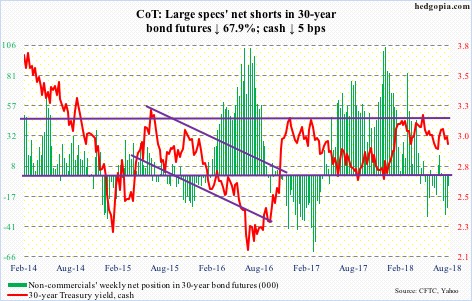
Major economic releases next week are as follows.
On Tuesday, the S&P Case-Shiller home price index for June is on the docket. Nationally, home prices increased 6.4 percent year-over-year in May.
GDP (2Q18, 2nd estimate) and corporate profits (2Q18) are on tap Wednesday.
The first estimate showed real GDP expanded 4.1 percent last quarter.
In 1Q18, corporate profits with inventory valuation and capital consumption adjustments increased 4.3 percent on an annual basis to a seasonally adjusted annual rate of $2.2 trillion. Profits peaked at $2.23 trillion in 4Q14.
July’s personal income and spending is due out Thursday. In the 12 months to June, core PCE (personal consumption expenditures) – the Fed’s favorite measure of consumer inflation – rose 1.9 percent. The last time this metric grew with a two handle was in April 2012.
Friday brings the final reading of August’s University of Michigan consumer sentiment index. Preliminarily, sentiment dropped 2.6 points m/m to 95.3. March’s 101.8 was the highest since January 2004.
Crude oil: Currently net long 590.7k, down 30.9k.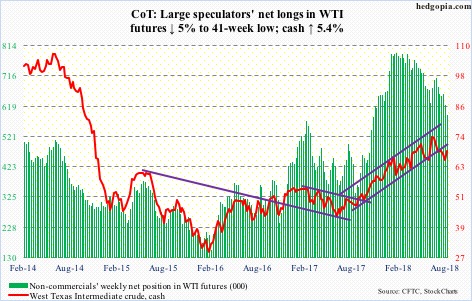
After having defended the 200-day last week, bulls seized on the EIA report Wednesday. Spot West Texas Intermediate crude ($68.72/barrel) rallied 3.1 percent in that session. For the week of August 17, US crude stocks fell 5.8 million barrels to 408.4 million barrels. Crude imports dropped 1.5 million barrels per day to 7.5 mb/d. Refinery utilization remained unchanged at 98.1 percent. Gasoline and distillate stocks, however, increased 1.2 million barrels and 1.8 million barrels respectively to 234.3 million barrels and 130.8 million barrels. Crude production rose 100,000 b/d to 11 mb/d.
Two weeks ago, WTI lost a rising trend line from June last year, followed by rejection last week at the underside of that. This now extends to around $69. There is also horizontal resistance at $69-69.50, with the 50-day at $68.85. Friday, the crude tried to take out this hurdle as it rallied to $69.31 intraday, but was rejected.
E-mini S&P 500: Currently net long 124.2k, down 55.5k.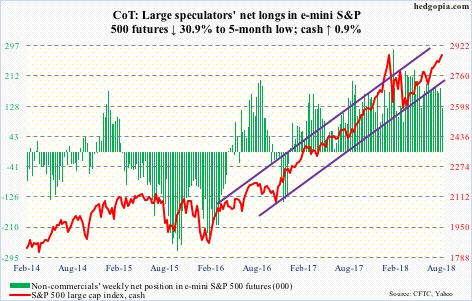
For the second consecutive week through Wednesday, all three S&P 500-focused ETF’s saw positive flows, with SPY (SPDR S&P 500 ETF) taking in $1.2 billion, VOO (Vanguard S&P 500 ETF) $381 million and IVV (iShares core S&P 500 ETF) $801 million (courtesy of ETF.com). In the same week, US-based equity funds (including ETF’s) gained $1.8 billion (courtesy of Lipper.com).
This was put to good use as the cash (2874.69) rallied 0.9 percent last week to a new intraday high of 2876.16 – past the prior high of 2872.87 from late January. The January high has been surpassed, but barely. Plus, prior to Friday’s 0.6-percent rally, Tuesday saw a shooting star and Wednesday a doji. On the weekly chart, this week produced a solid white candle. But this was preceded by a weekly hanging man and a shooting star before that.
Interestingly, even as the S&P 500 rose to a new high, investor sentiment is nowhere near how it behaved leading up to the late-January highs (more on this here). Depending on how things shake out in the weeks ahead, this can be good or bad. For now, the index probably needs to unwind its overbought condition.
Euro: Currently net short 4.8k, up 3k.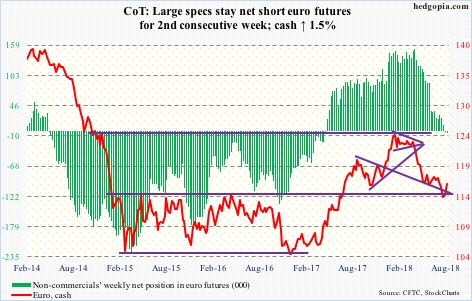
No sooner did the cash ($116.21) lose $114-115 than it rallied to recapture the crucial support-turned-resistance. Wednesday, the euro rallied intraday to $116.24, before getting rejected at the 50-day. In the very next session, the intraday drop to $115.30 was bought, followed by Friday’s 0.7-percent rally.
The daily chart is getting extended, but euro bulls have clearly put their foot down. Last week produced a potentially bullish weekly hammer.
Gold: Currently net short 8.7k, up 5k.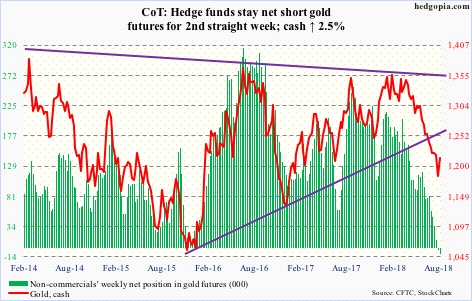
Gold bugs this week essentially said ‘enough is enough’. Thursday last week, the cash ($1,213.3/ounce) dropped to an intraday low of $1,167.10. This was preceded by loss of one after another support since peaking early April. This week, in a long-legged doji session Wednesday the metal rallied to $1,208.40 before sellers showed up. Two weeks ago, gold lost support at $1,210-ish. So rejection here at the first try is not all that surprising. Come Friday, the metal rallied 1.6 percent to essentially close at that broken support.
It takes time to repair the technical damage gold has suffered since that April peak. This is particularly so as money continues to leave gold-focused ETF’s. In the week to Wednesday, IAU (iShares gold trust) saw no activity but GLD (SPDR gold ETF) bled another $224 million (courtesy of ETF.com). In 16 out of last 17 weeks, GLD lost $4.1 billion. IAU lost $1.2 billion in the last 14. But recent price action is encouraging. Recall that non-commercials have just about given up. For the second straight week, they are net short gold futures. The last time they went net short was 16 years ago. These traders tend to be trend followers, and will be telling once they start going long.
Nasdaq 100 index (mini): Currently net long 31.1k, down 6.4k.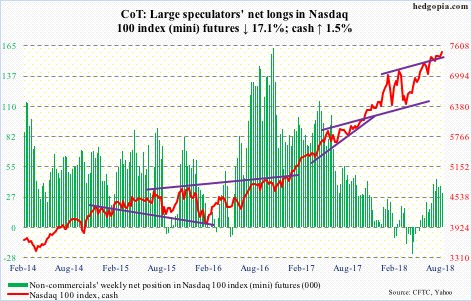
Bulls this week meaningfully pushed off of last week’s defense of 7300. The cash (7485.4) five weeks ago rose to a new all-time high of 7511.39 but only to get rejected at six-month channel resistance. Subsequently, a falling trend line from that high resisted rally attempts. Friday’s one-percent rally puts the Nasdaq 100 right at that trend line. A breakout opens the door to a test of that high, which is merely 0.3 percent away. At least until Tuesday, non-commercials were not expecting this outcome, as they cut back net longs, but this may have changed Friday. Elsewhere, flows of late have been off and on, but QQQ (Invesco QQQ Trust) gained $646 million in the week ended Wednesday (courtesy of ETF.com).
Russell 2000 mini-index: Currently net long 3.7k, down 10.5k.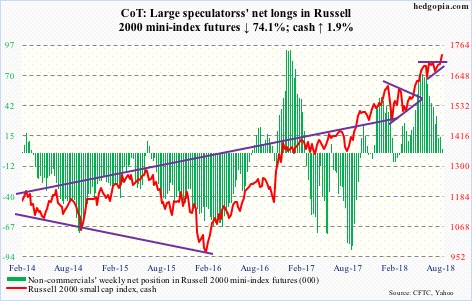
A breakout at long last! After going back and forth within a pennant for a couple of months, the cash (1725.67) broke out Tuesday. This preceded a strong rally, so this can be part of a continuation pattern. At least the bulls hope so. If so, using a measured-move target, technically-oriented longs could be eyeing 1780s on the Russell 2000 index.
Flows were in full cooperation in the week through Wednesday. IWM (iShares Russell 2000 ETF) took in $300 million and IJR (iShares core S&P small-cap ETF) $252 million. The daily chart is extended. It will be interesting what transpires when breakout retest occurs at 1710.
US Dollar Index: Currently net long 34.1k, up 2.1k.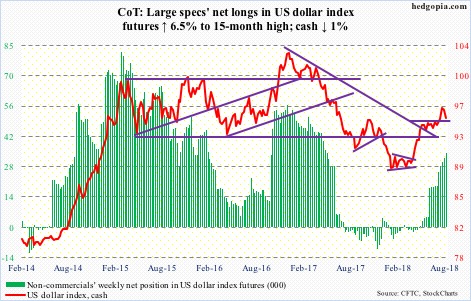
Dollar bulls and bears are duking it out. Early this month, the cash (95.06) broke out of 95-plus, before rallying to 96.87 intraday in a shooting star session on Wednesday last week. This was an opening for the bears, and they took it. The subsequent decline stopped this Wednesday at the 50-day, with a session low of 94.83.
Incidentally, the intraday high eight sessions ago approximated a 50-percent retracement of the decline between July 2001 (121.21) and April 2008 (71.33). Thus the significance of 95-plus. If it is a genuine breakout, this needs to be defended. With weekly momentum indicators way overbought, it is not going to be easy for the bulls.
VIX: Currently net short 101.8k, down 29.6k.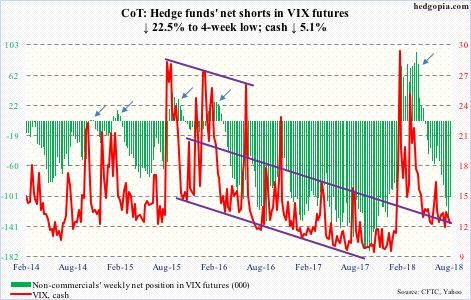
The cash (11.99) quickly retreated from 16.86 eight sessions ago to Thursday’s low of 11.65. With this, two-and-a-half-month support at 11-plus has once again been tested – successfully thus far. In a worse-case scenario near term, the lower Bollinger band lies at 10.40. Concurrently, the VIX-to-VXV ratio quickly went from 0.958 on August 15 to 0.809 this Friday – from overbought to oversold.
Disclaimer: This article is not intended to be, nor shall it be construed as, investment advice. Neither the information nor any opinion expressed here constitutes an offer to buy or sell any ...
more

