
Following futures positions of non-commercials are as of Aug 1, 2023.
10-year note: Currently net short 645.2k, up 21.4k.
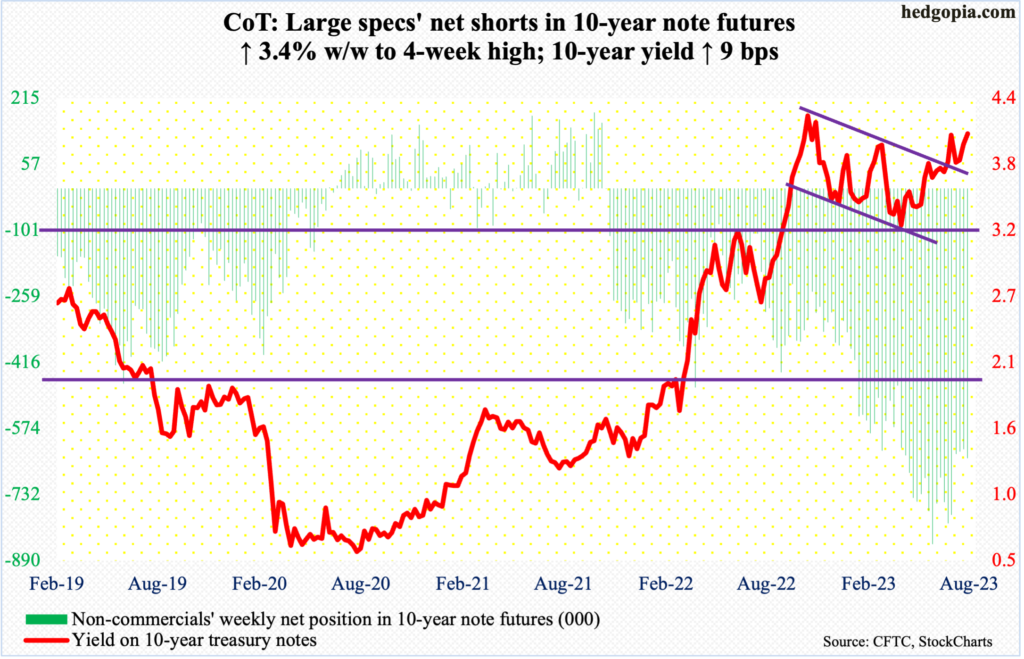
No sooner did the 10-year treasury yield break out of 4.09 percent, which resisted rally attempts in February and early July, than it went back under by the end of the week, touching as high as 4.21 percent intraday Friday but finishing the session at 4.06 percent. Last October’s high of 4.33 percent, therefore, stands; from that high, yields dropped to subsequently bottom at 3.25 percent in April.
Despite Friday’s intraday reversal, the 10-year has been chirping along for a while now. The long end of the yield curve is not on the same page with fed funds futures, where traders are not only betting that the fed funds rate has peaked with last month’s 25-basis-point hike to a range of 525 basis points to 550 basis points but also that the Federal Reserve would begin to cut next March and that the benchmark rates would end 2024 between 400 basis points and 425 basis points.
For the central bank to lower rates with that aggression, the economy needs to meaningfully decelerate from here or even enter recession. The 10-year yield is nowhere near as pessimistic. Bond bears are probably also paying attention to the budget deficit and the accompanying need to issue more debt, even as the Fed is reducing its holdings of these securities (more on this here).
This explains why non-commercials continue to sit on boatloads of net shorts in 10-year note futures. The supply-demand dynamics favor them, with the caveat that at some point this will all be in the price. A takeout of 4.09 percent, followed by a higher high past last October’s high will have meaningfully changed the odds in their favor. Until then, the risk in the quarters ahead is that fed funds futures traders will have nailed it – which then would have helped pull the 10-year yield lower.
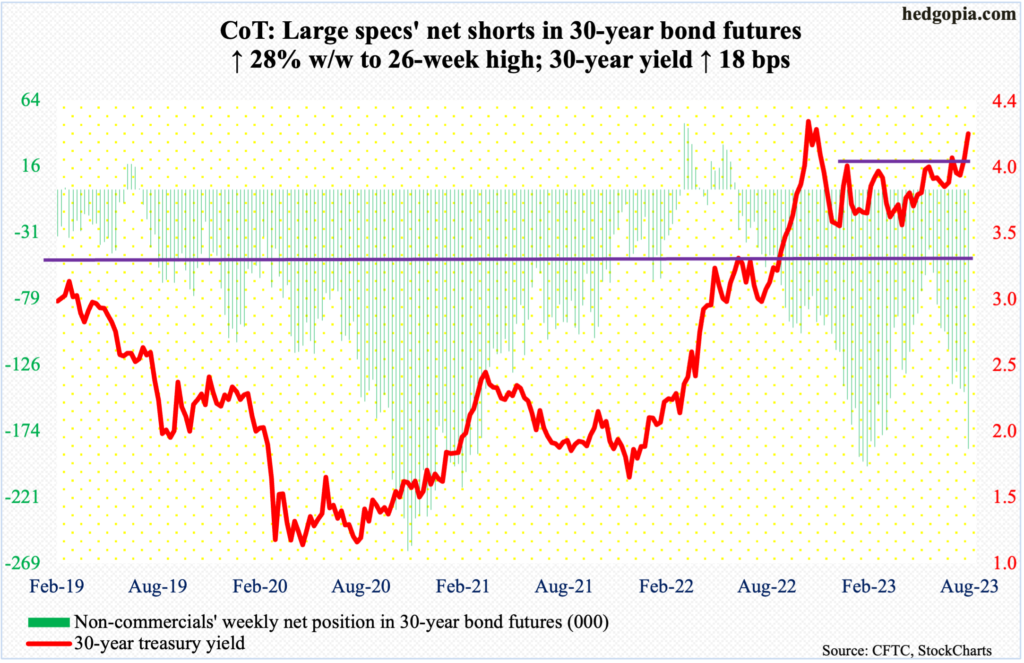
30-year bond: Currently net short 186.7k, up 40.8k.
Major US economic releases for next week are as follows.
The NFIB optimism index (July) is due out on Tuesday. In June, small-business optimism increased 1.6 points month-over-month to 91, which was a seven-month high.
Thursday brings consumer price index (July). In the 12 months to June, headline and core CPI rose three percent and 4.8 percent, in that order. The two respectively peaked last year at 9.1 percent in June and at 6.6 percent in September.
The producer price index (July) and the University of Michigan’s consumer sentiment index (August, preliminary) are scheduled for Friday.
In the 12 months to June, headline and core PPI rose 0.1 percent and 2.6 percent respectively.
In July, consumer sentiment jumped 7.2 points m/m to 71.6 – a 21-month high. In June last year, sentiment hit a record low 50.
WTI crude oil: Currently net long 276.9k, up 9.2k.
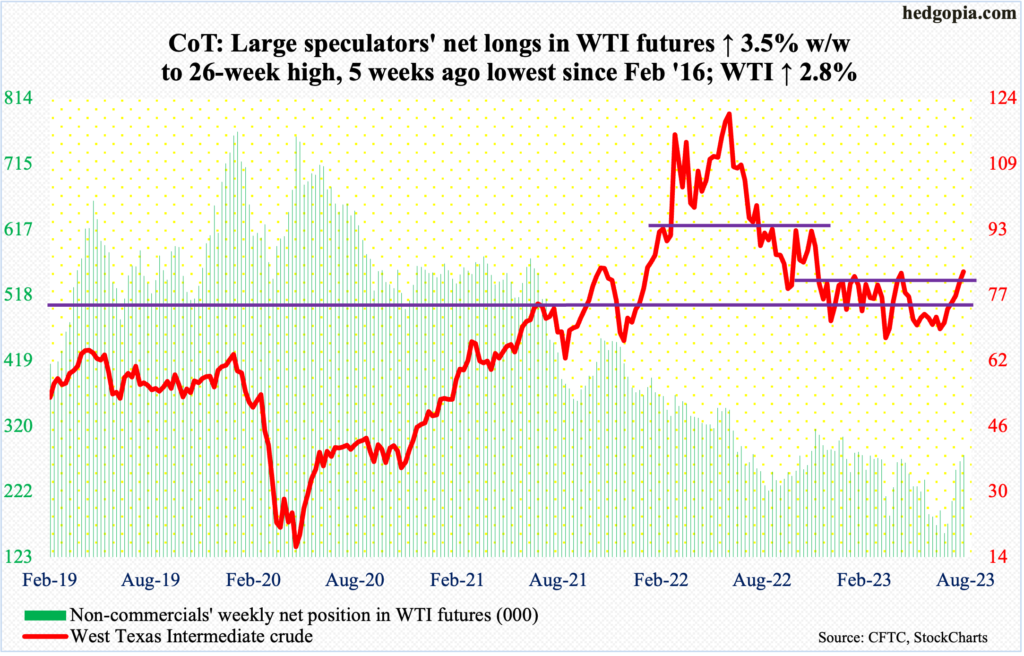
West Texas Intermediate crude ($82.82/barrel) finally poked its head out of an eight-month range between $71-$72 and $81-$82. It has now rallied for six weeks in a row. Friday’s intraday high of $83.24 came within $0.29 of the prior high from April 12; back then, the crude reversed hard before bottoming at $63.57 on May 4.
WTI is extended on the daily but can continue to rally in the right circumstances. On the fundamental front, Saudi Arabia this week said it will extend a voluntary output cut of one million barrels per day by one more month to include September; this was followed by Russia’s announcement that it too will cut oil exports by 300,000 b/d in September. Technically, a takeout of the April high will help establish a higher high.
In the meantime, as per the EIA, US crude production in the week to July 28 was unchanged week-over-week at 12.2 mb/d. Crude imports increased 301,000 b/d to 6.7 mb/d. Gasoline stocks rose as well, up 1.5 million barrels to 219.1 million barrels. Stocks of crude and distillates, however, dropped – respectively by 17 million barrels and 796,000 barrels to 439.8 million barrels (29-week low) and 117.2 million barrels. Refinery utilization edged lower seven-tenths of a percentage point to 92.7 percent.
E-mini S&P 500: Currently net short 200k, down 32.6k.
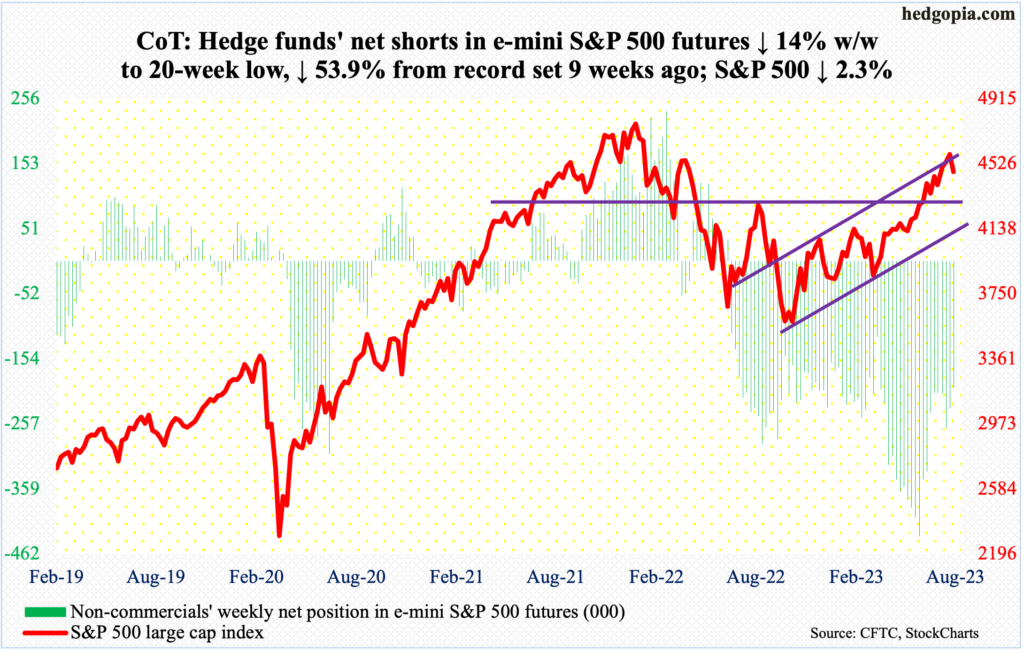
August is young, but the month is acting weak out of the gate. After five consecutive up months, August thus far is down 2.4 percent. For the week, the S&P 500 gave back 2.3 percent, forming a red marubozu close.
Sellers appeared this week just north of trendline resistance of an ascending channel from last October’s low. Rather ominously, on July 27, the large cap index ticked 4607 – up 31.9 percent from last October’s low – but only to end the session with a massive bearish engulfing candle. This was a warning shot across the bow of equity bulls, who are sitting on tons of paper profit in a market that trades at elevated multiples (more on this here).
On June 12, the S&P 500 (4478) broke out of 4320s. This level has now gained in importance. A breakout retest probably lies ahead. There has already been a successful retest – on June 26. Bulls’ mettle will be tested – again.
Euro: Currently net long 172.1k, down 5.2k.
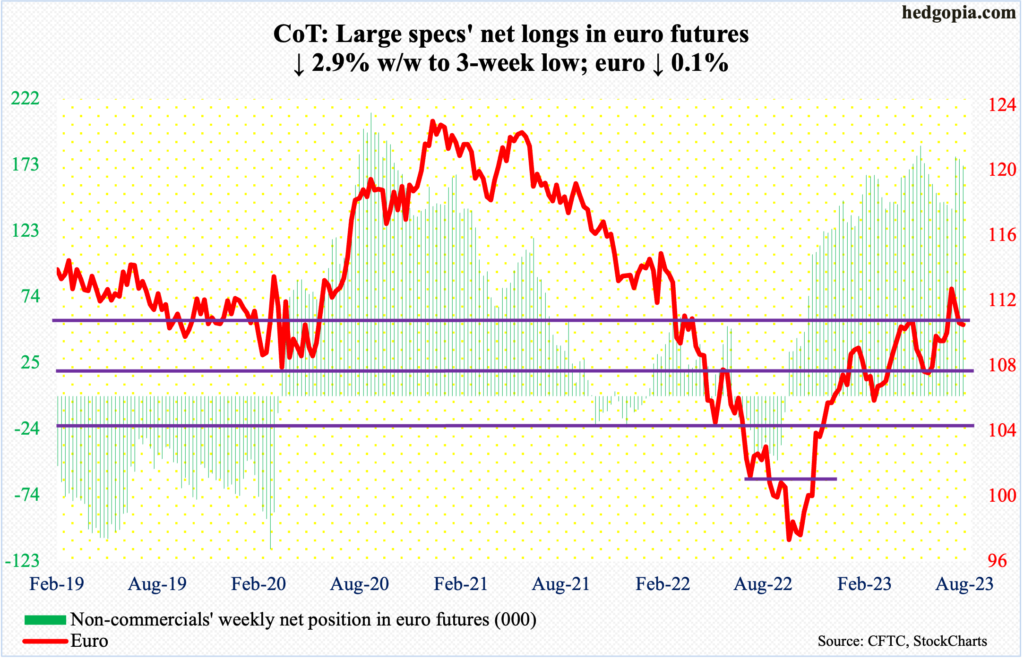
July was positive, but with a very long upper wick. Last Thursday when the European Central Bank raised its benchmark rate by 25 basis points and signaled that a pause in September was possible, the euro formed a massive bearish engulfing candle. Leading up to this, it reversed lower on July 26 after ticking $1.1270 intraday. The currency has had quite a rally – from last September’s low of $0.9559, and $1.0635 in late May.
This week, it edged lower 0.1 percent to $1.1011. This was the second week in a row the euro closed at support. Three weeks ago, it broke out of $1.09-$1.10.
As things stand, there is room for the daily to head higher.
Gold: Currently net long 164.9k, down 8.7k.
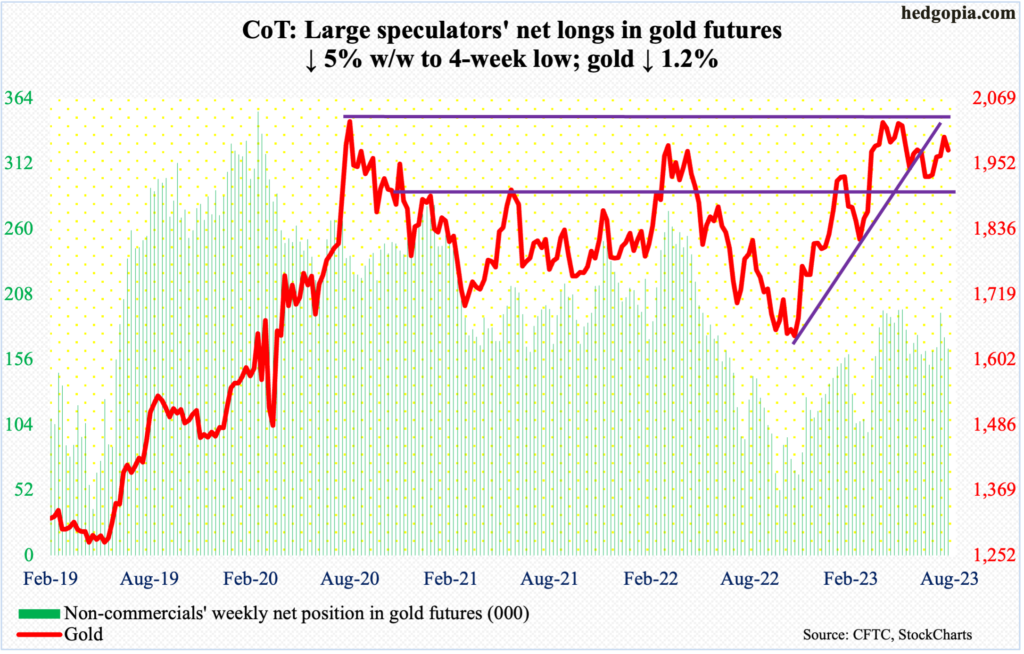
Gold bugs tried to go after it but came up short. The week opened with Monday’s $10 rally to $2010, past $2000, which, if it held, would have probably opened the door toward $2,080s. That was not to be, as gold weakened in the next three of four sessions to finish the week at $1,976/ounce.
For bulls’ consolation, Friday’s intraday weakness to $1,955 was bought – enough to keep the mettle north of the 50-day moving average ($1,959).
For now, the yellow metal remains in limbo – between $1,920s and $2,000. It is only after $2,000 is taken care of that the bulls have another shot at $2,080s, which has rejected several breakout attempts.
On May 4 (this year), in a spinning top session, the metal ticked $2,085 before pulling back. In the past, $2,089 was tagged in August 2020 – an all-time high – and $2,079 in March 2022.
Nasdaq 100 index (mini): Currently net short 11.4k, up 733.
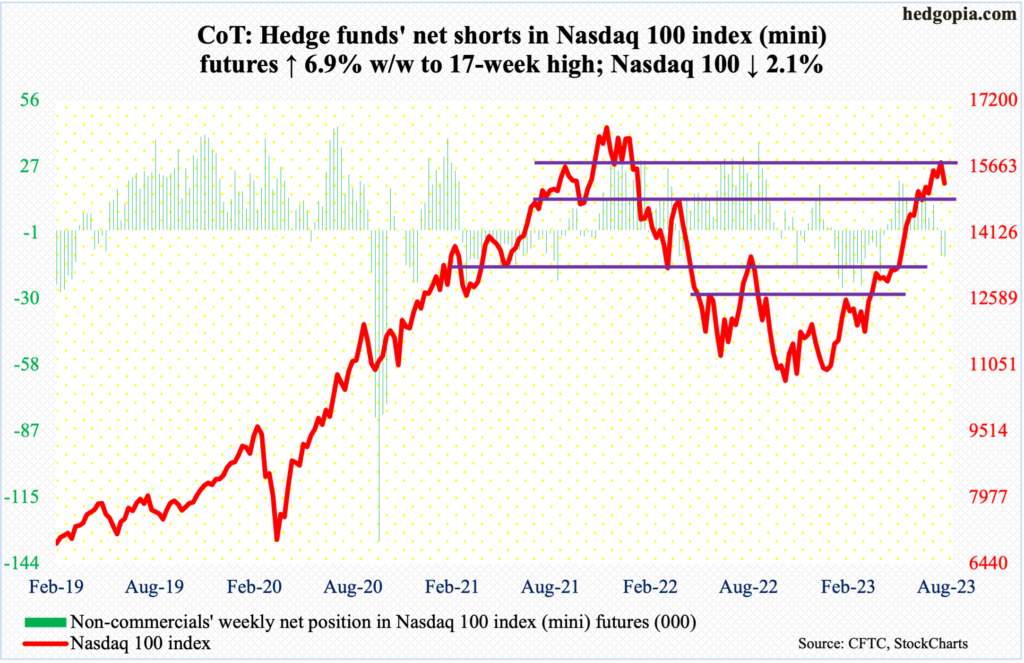
Thursday, Apple (AAPL) and Amazon (AMZN) reported their June quarter. With 11.6 percent weighting in the Nasdaq 100, AAPL is the leading stock out there; AMZN with a 5.1 percent weight is the fourth largest – after Microsoft’s (MSFT) 9.4 percent and Google parent Alphabet’s (GOOG) 5.9 percent.
Come Friday, AAPL dropped 4.8 percent, slicing through its 50-day, even as AMZN rallied 8.3 percent but ended the session with a daily shooting star. When it was all said and done, AAPL shed 7.1 percent for the week to $181.99 with a nasty looking candle; two weeks before that, it rallied to a new high of $198.23 but only to essentially give it all back to form a weekly gravestone doji. Odds favor AAPL bulls will be unable to save the make-or-break $180-$181 in the sessions ahead.
AAPL is too influential not to adversely impact the Nasdaq 100. The tech-heavy index (15275) essentially closed at 15280s support. After this lies lateral support at 14600s.
Non-commercials, who have been net short for two weeks after 14 consecutive weeks of staying net long, are anticipating tough times ahead.
Russell 2000 mini-index: Currently net short 66.3k, down 2.5k.
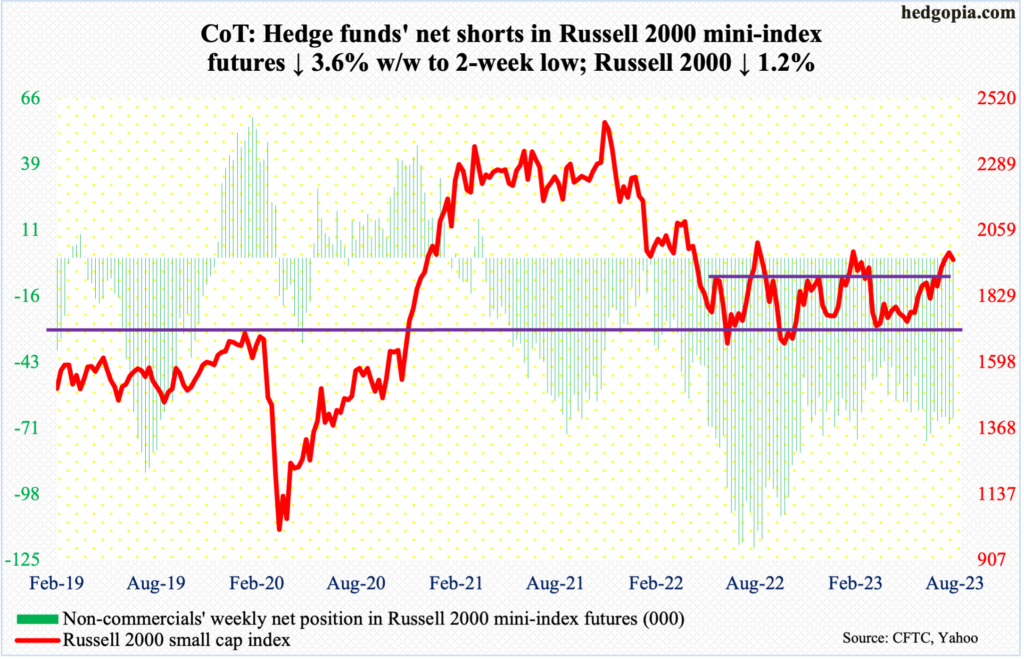
On Monday, the Russell 2000 was less than four points from the February high of 2007. A higher high would have solidly built on the June 11 range breakout. Since January last year, the small cap index had been caught in a 200-point range between 1700 and 1900.
But, as the week progressed, the index progressively closed lower, ending the week at 1957. Small-cap bulls can draw solace in the fact that the index remains comfortably above 1900. A breakout retest looks imminent.
US Dollar Index: Currently net long 3.1k, down 2.9k.
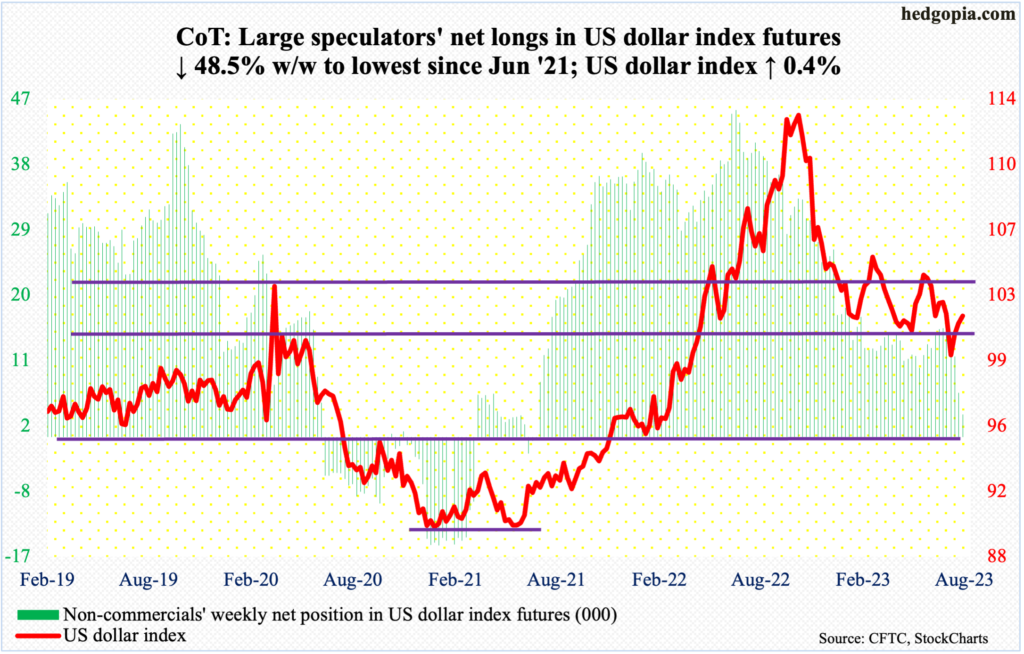
For the first time in nearly a month, the US dollar index closed past the 50-day on Wednesday, but that proved fleeting, as it was pushed back under in the very next session.
The index rallied 0.4 percent for the week – its third up week in a row – but also left a long upper wick on the weekly. There is room for it to head higher on the daily. Horizontal support at 100-101, which goes back eight years, is intact. In the right circumstances, the US dollar index (101.84) has a chance to rally toward 103-104.
VIX: Currently net short 42.2k, up 24.
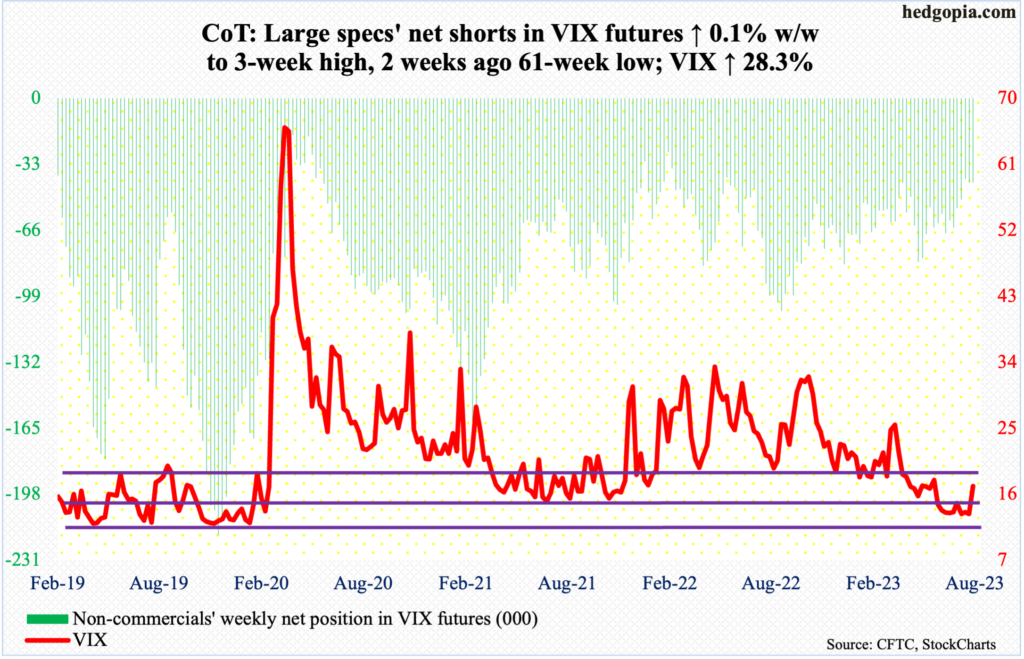
Volatility came to life this week, rallying past the 50-day. This was the first time since May 24 VIX closed above the average. For the week, it jumped 3.77 points to 17.10. Prior to this, the volatility index went sideways just above 13 for six weeks.
Notwithstanding near-term, several indicators on the monthly are itching to move higher from oversold territory.
Thanks for reading!
More By This Author:
Rates, Budget Deficit, Treasury Debt Issuance And Federal Interest Payments – All Rising
Combination Of Higher Prices And Lower Earnings Pushes Up Multiples
What CoT Shows About The Future Thru Futures, What Hedge Funds Are Buying


Comments
Log in or sign up to join the conversation.